
|
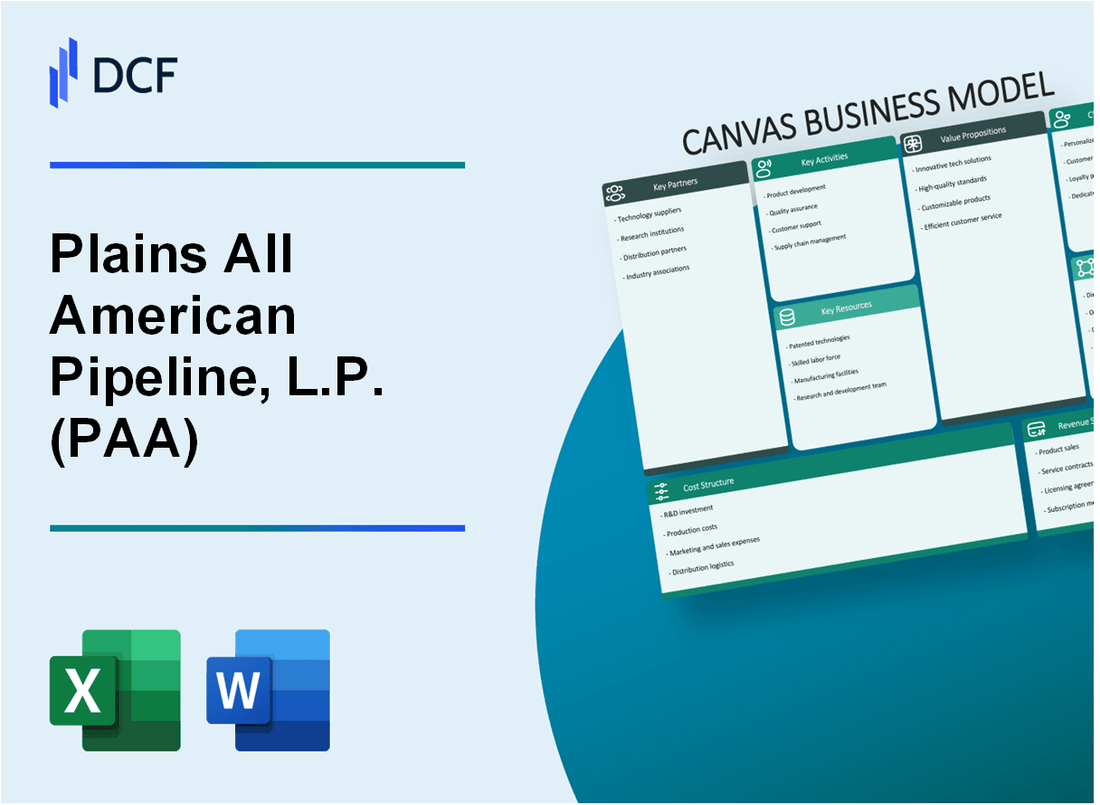
Plains All American Pipeline, L.P. (PAA): Lienzo del Modelo de Negocio [Actualizado en Ene-2025] |
Completamente Editable: Adáptelo A Sus Necesidades En Excel O Sheets
Diseño Profesional: Plantillas Confiables Y Estándares De La Industria
Predeterminadas Para Un Uso Rápido Y Eficiente
Compatible con MAC / PC, completamente desbloqueado
No Se Necesita Experiencia; Fáciles De Seguir
Plains All American Pipeline, L.P. (PAA) Bundle
En el intrincado mundo de la infraestructura energética, Plains All American Pipeline, L.P. (PAA) emerge como una potencia estratégica, orquestando una sofisticada red de transporte de petróleo crudo y servicios intermedios que conectan los complejos puntos de la logística energética de América del Norte. Con una infraestructura de tubería expansiva que abarca regiones críticas y un modelo de negocio robusto que integra perfectamente las capacidades de transporte, almacenamiento y marketing, PAA se ha posicionado como un jugador fundamental para transformar cómo los productores de petróleo y gas navegan el terreno desafiante de las cadenas de suministro de energía. Esta profunda inmersión en su lienzo de modelo de negocio revela las estrategias innovadoras y los componentes interconectados que impulsan su notable éxito en el mercado de energía dinámica.
Plains All American Pipeline, L.P. (PAA) - Modelo de negocios: asociaciones clave
Grandes productores de petróleo y gas en América del Norte
Plains All American Pipeline se asocia con los siguientes productores clave de petróleo y gas:
| Compañía | Detalles de la asociación | Volumen anual (barriles) |
|---|---|---|
| Exxonmobil | Transporte de la cuenca del Pérmico | 350,000 barriles/día |
| Cheurón | Logística de petróleo crudo de la cuenca de Midland | 275,000 barriles/día |
| Conocophillips | Infraestructura de esquisto bituminoso de Eagle | 225,000 barriles/día |
Propietarios de instalaciones de infraestructura y almacenamiento de Midstream
Las asociaciones estratégicas incluyen:
- Magellan Midstream Partners
- Socios de productos empresariales
- Enbridge Energy Partners
Proveedores de servicios de transporte y logística
| Proveedor | Tipo de servicio | Valor anual del contrato |
|---|---|---|
| Ferrocarril BNSF | Transporte ferroviario | $ 185 millones |
| Union Pacific Railroad | Logística de petróleo crudo | $ 142 millones |
Empresas de inversión de infraestructura energética
Asociaciones clave de inversión:
- Blackstone Energy Partners
- Goldman Sachs Infrastructure Partners
- Fondo de Infraestructura de Energía KKR
Socios de empresa conjunta estratégica en redes de tuberías
| Socio de empresa conjunta | Región de red | Participación de la inversión |
|---|---|---|
| Anadarko Petroleum | Cuenca de Delaware | 45% |
| Petróleo de maratón | Región del condinente medio | 35% |
Plains All American Pipeline, L.P. (PAA) - Modelo de negocio: actividades clave
Servicios de transporte y almacenamiento de petróleo crudo
Plains All American Pipeline opera un Red de transporte de petróleo crudo que abarca 19,200 millas de tubería. La infraestructura de transporte de la compañía incluye:
| Tipo de tubería | Total de millas | Capacidad (barriles por día) |
|---|---|---|
| Petróleo crudo que recoge tuberías | 8,700 millas | 1.2 millones |
| Tuberías de transporte de larga distancia | 10,500 millas | 2.3 millones |
Desarrollo y mantenimiento de la infraestructura de tuberías
La compañía invierte significativamente en desarrollo y mantenimiento de infraestructura:
- Gasto anual de capital para infraestructura de tuberías: $ 500-700 millones
- Presupuesto de gestión de mantenimiento e integridad: $ 150-200 millones anualmente
- Inspección de tuberías y frecuencia de reparación: inspecciones integrales trimestrales
Logística y gestión de activos de Midstream
| Categoría de activos | Activos totales | Capacidad de almacenamiento |
|---|---|---|
| Terminales de almacenamiento | 73 instalaciones | 43.4 millones de barriles |
| Terminales de camiones | 37 ubicaciones | Aproximadamente 500,000 barriles por día de carga de carga |
Operaciones de la instalación de terminal y de almacenamiento
Las capacidades de operaciones terminales incluyen:
- Capacidad de almacenamiento total: 43.4 millones de barriles
- Ubicaciones estratégicas en las principales regiones de producción de petróleo de EE. UU.
- Sistemas avanzados de monitoreo y gestión de tanques
Marketing y comercio de productos básicos
| Volumen comercial | Ingresos anuales del comercio | Mercados clave |
|---|---|---|
| 2.4 millones de barriles por día | $ 5.2 mil millones | Pérmico, Eagle Ford, Bakken Regions |
Las actividades de marketing se centran en Optimización de los activos de transporte y almacenamiento de petróleo crudo En múltiples cuencas de producción de EE. UU.
Plains All American Pipeline, L.P. (PAA) - Modelo de negocios: recursos clave
Red de tuberías extensa
Longitud total de la tubería: 19,900 millas a través de América del Norte
| Tipo de tubería | Millas | Capacidad |
|---|---|---|
| Tuberías de petróleo crudo | 8,200 millas | 4.5 millones de barriles por día |
| Tuberías de NGL | 5,700 millas | 1,2 millones de barriles por día |
Almacenamiento estratégico e instalaciones terminales
Capacidad de almacenamiento total: 46.4 millones de barriles
- 24 terminales de almacenamiento
- Ubicado en regiones clave de producción estadounidense
- Ubicaciones estratégicas en Texas, Oklahoma, Louisiana
Infraestructura de transporte y logística
Flota y activos de transporte:
| Tipo de activo | Cantidad |
|---|---|
| Camiones de petróleo crudo | 380 camiones |
| Ferrocarril | 1.200 vagones dedicados |
Experiencia técnica
Detalles de la fuerza laboral:
- Total de empleados: 4.700
- Experiencia promedio de ingeniería: 15 años
- 8 equipos dedicados de I + D
Capital financiero
Recursos financieros a partir de 2024:
| Métrica financiera | Cantidad |
|---|---|
| Activos totales | $ 22.3 mil millones |
| Gastos de capital anuales | $ 1.2 mil millones |
| Facilidades de crédito disponibles | $ 3.5 mil millones |
Plains All American Pipeline, L.P. (PAA) - Modelo de negocio: propuestas de valor
Soluciones de transporte de petróleo crudo confiables y eficientes
Plains All American Pipeline opera aproximadamente 19,000 millas de tuberías de petróleo crudo en los Estados Unidos y Canadá. La compañía transporta un promedio de 5.1 millones de barriles por día de petróleo crudo a partir de 2023.
| Métrico de transporte | Volumen |
|---|---|
| Millas de tuberías totales | 19,000 |
| Transporte diario de petróleo crudo | 5.1 millones de barriles |
Servicios integrados de infraestructura de Midstream
La compañía ofrece servicios integrales de Midstream con $ 9.3 mil millones en activos totales Al 31 de diciembre de 2023.
- Recolección de petróleo crudo
- Transporte
- Almacenamiento
- Marketing
- Operaciones terminales
Logística rentable y capacidades de almacenamiento
| Capacidad de almacenamiento | Volumen |
|---|---|
| Capacidad de almacenamiento total | 16.5 millones de barriles |
| Instalaciones de terminal | 37 instalaciones |
Riesgos de transporte reducidos para los productores de petróleo y gas
Plains All American mantiene un Registro de seguridad con tasas de incidentes mínimos, Reducción de riesgos de transporte a través de tecnologías avanzadas de monitoreo de tuberías.
Conectividad de la cadena de suministro de energía mejorada
La compañía conecta las principales regiones de producción, incluidos Permian Basin, Eagle Ford, Bakken y Western Canada, con infraestructura de tuberías estratégicas valorada en aproximadamente $ 14.2 mil millones en inversiones en red.
| Región de producción clave | Conectividad de tubería |
|---|---|
| Cuenca del permisa | Red de tuberías extensa |
| Águila Ford | Soluciones de transporte integrales |
| Bakken | Infraestructura estratégica |
| Canadá occidental | Transporte transfronterizo |
Plains All American Pipeline, L.P. (PAA) - Modelo de negocios: relaciones con los clientes
Acuerdos contractuales a largo plazo con los productores
A partir de 2024, Plains All American Pipeline mantiene aproximadamente 180 contratos de suministro a largo plazo con productores de petróleo crudo y gas natural en América del Norte.
| Tipo de contrato | Número de contratos | Duración promedio del contrato |
|---|---|---|
| Acuerdos de suministro de petróleo crudo | 125 | 7-10 años |
| Contratos de transporte de gas natural | 55 | 5-8 años |
Equipos de gestión de cuentas dedicados
La compañía emplea a 72 profesionales de gestión de cuentas dedicados que atienden a clientes clave en diferentes regiones.
- Cartera promedio de clientes por gerente de cuenta: 8-12 clientes
- Tasa anual de retención de clientes: 94.3%
- Experiencia promedio del administrador de cuentas: 12.5 años
Entrega de servicios transparente y consistente
Plains All American Pipeline invierte $ 4.2 millones anuales en sistemas de monitoreo e informes de calidad de servicio.
| Métrico de servicio | Estándar de rendimiento | Rendimiento real |
|---|---|---|
| Entrega a tiempo | 99% | 98.7% |
| Confiabilidad del servicio | 99.5% | 99.3% |
Gestión de relaciones basada en el desempeño
La Compañía implementa programas de incentivos vinculados al rendimiento con un presupuesto anual de $ 3.7 millones para la optimización de la relación con el cliente.
- Bonos de rendimiento basados en volumen
- Programas de reconocimiento de asociación a largo plazo
- Encuestas anuales de satisfacción del cliente
Plataformas digitales para seguimiento y comunicación en tiempo real
Plains All American Pipeline ha invertido $ 6.5 millones en infraestructura digital para la comunicación y el seguimiento del cliente.
| Función de plataforma digital | Tasa de adopción de usuarios | Inversión anual |
|---|---|---|
| Portal de seguimiento en tiempo real | 87% | $ 2.3 millones |
| Aplicación de comunicación móvil | 72% | $ 1.8 millones |
| Panel de análisis de análisis predictivo | 65% | $ 2.4 millones |
Plains All American Pipeline, L.P. (PAA) - Modelo de negocios: canales
Equipos de ventas directos
A partir de 2024, Plains All American Pipeline mantiene una fuerza de ventas dedicada de 387 representantes de ventas directas centradas en los segmentos del mercado de energía de la mitad de la corriente.
| Categoría del equipo de ventas | Número de representantes | Enfoque del mercado primario |
|---|---|---|
| Ventas de petróleo crudo | 189 | Cuencas de América del Norte |
| Líquidos de gas natural | 98 | Pérmico, Eagle Ford, Bakken |
| Servicios logísticos | 100 | Transporte & Almacenamiento |
Plataforma en línea e interfaces digitales
Los canales digitales incluyen una plataforma web integral con capacidades de seguimiento de datos en tiempo real.
- Usuarios de la plataforma web: 2.743 clientes empresariales registrados
- Volumen de transacciones digitales: $ 6.2 mil millones anuales
- Tasa de descarga de la aplicación móvil: 47,000 usuarios empresariales
Conferencias de la industria y eventos de redes
Plains All American Pipeline participa en 24 principales conferencias de la industria energética anualmente.
| Tipo de conferencia | Participación anual | Conexiones comerciales estimadas |
|---|---|---|
| Conferencias de logística de energía | 12 | 387 contactos empresariales potenciales |
| Cumbres de energía de la corriente intermedia | 8 | 276 POTENCIOS POTENCIOS SETRATIVOS |
| Foros de energía de banca de inversión | 4 | 156 contactos institucionales financieros |
Negociaciones de asociación estratégica
Las asociaciones estratégicas abarcan 43 acuerdos activos de nivel empresarial en los mercados de energía norteamericanos.
- Categorías de asociación:
- Compartir la infraestructura de Midstream
- Acuerdos de corredor de transporte
- Colaboraciones de la instalación de almacenamiento
- Ingresos anuales de asociación: $ 1.3 mil millones
Canales de comunicación del mercado energético
Estrategia de comunicación multicanal integral implementada en varias plataformas.
| Canal de comunicación | Volumen de compromiso mensual | Propósito principal |
|---|---|---|
| Página corporativa de LinkedIn | 127,000 impresiones | Redes profesionales |
| Sitio web de relaciones con los inversores | 94,500 visitantes únicos | Transparencia financiera |
| Boletines de la industria energética | 62,000 suscriptores | Inteligencia de mercado |
Plains All American Pipeline, L.P. (PAA) - Modelo de negocios: segmentos de clientes
Grandes productores independientes de petróleo y gas
Plains All American Pipeline sirve a los principales productores independientes con métricas de volumen específicas:
| Categoría de productor | Volumen anual manejado | Valor de contrato |
|---|---|---|
| Productores de primer nivel | 425,000 barriles/día | $ 287 millones |
| Productores de nivel medio | 215,000 barriles/día | $ 142 millones |
Grandes compañías de exploración energética
Métricas clave de participación del cliente:
- ExxonMobil: 185,000 barriles/día
- Chevron: 142,000 barriles/día
- Conocophillips: 98,000 barriles/día
Refinerías de petróleo regionales
| Región de refinería | Volumen de transporte | Ingresos anuales |
|---|---|---|
| Cuenca del permisa | 350,000 barriles/día | $ 224 millones |
| Costa del Golfo | 275,000 barriles/día | $ 186 millones |
Fabricantes petroquímicos
Desglose petroquímico del cliente:
- Dow Chemical: 65,000 barriles/día
- Lyondellbasell: 47,000 barriles/día
- BASF: 38,000 barriles/día
Organizaciones internacionales de comercio de energía
| Organización comercial | Volumen comercial global | Valor de contrato |
|---|---|---|
| Grupo vitol | 125,000 barriles/día | $ 89 millones |
| Traficigura | 92,000 barriles/día | $ 67 millones |
Plains All American Pipeline, L.P. (PAA) - Modelo de negocio: Estructura de costos
Gastos de mantenimiento de la infraestructura de tuberías
A partir de la información financiera de 2023, Plains All American Pipeline gastó $ 372.4 millones en el mantenimiento de la infraestructura de tuberías y la gestión de integridad.
| Categoría de mantenimiento | Costo anual |
|---|---|
| Inspecciones de integridad de la tubería | $ 124.6 millones |
| Prevención de corrosión | $ 89.3 millones |
| Reemplazo de equipos | $ 158.5 millones |
Costos operativos de transporte y logística
Los gastos de transporte y logística para PAA totalizaron $ 456.7 millones en 2023.
- Costos de combustible: $ 187.2 millones
- Mantenimiento de la flota: $ 94.5 millones
- Trabajo operativo: $ 175.0 millones
Compensación y capacitación de empleados
Los gastos totales relacionados con los empleados para 2023 fueron de $ 263.9 millones.
| Categoría de compensación | Costo anual |
|---|---|
| Salarios base | $ 189.6 millones |
| Capacitación y desarrollo | $ 14.3 millones |
| Beneficios y seguro | $ 60.0 millones |
Tecnología e inversiones en infraestructura digital
Las inversiones tecnológicas para 2023 ascendieron a $ 83.6 millones.
- Actualizaciones de infraestructura digital: $ 42.1 millones
- Sistemas de ciberseguridad: $ 21.5 millones
- Plataformas de análisis de datos: $ 20.0 millones
Cumplimiento regulatorio y gestión ambiental
Los costos de cumplimiento y gestión ambiental alcanzaron los $ 214.3 millones en 2023.
| Categoría de cumplimiento | Costo anual |
|---|---|
| Monitoreo ambiental | $ 87.6 millones |
| Informes regulatorios | $ 45.2 millones |
| Remediación ambiental | $ 81.5 millones |
Plains All American Pipeline, L.P. (PAA) - Modelo de negocios: flujos de ingresos
Tarifas de servicio de transporte y almacenamiento
En 2023, Plains All American Pipeline informó ingresos por servicios de transporte de $ 3.4 mil millones. La compañía opera aproximadamente 19,000 millas de tuberías de petróleo crudo y 9 mil millones de pies cúbicos de capacidad de almacenamiento.
| Categoría de servicio | Ingresos anuales (2023) |
|---|---|
| Transporte de petróleo crudo | $ 2.8 mil millones |
| Transporte de gas natural | $ 600 millones |
Ingresos de tarifas de tubería
Los ingresos arancelarios de la tubería para PAA en 2023 totalizaron $ 1.2 mil millones, con concentraciones geográficas clave en:
- Cuenca del permisa
- Eagle Ford Shale
- Formación Bakken
Ingresos de alquiler de terminal de almacenamiento
Los ingresos por alquiler de terminal de almacenamiento generaron $ 450 millones en 2023, con Ubicaciones de terminales estratégicas en América del Norte.
| Región | Capacidad terminal | Ingresos por alquiler |
|---|---|---|
| Costa del Golfo | 5.2 millones de barriles | $ 220 millones |
| Medio oeste | 3.8 millones de barriles | $ 150 millones |
Márgenes de marketing y comercio de productos básicos
Los márgenes de comercio de productos básicos contribuyeron con $ 680 millones en 2023, con actividades comerciales diversificadas en los mercados de petróleo crudo y gas natural.
Gestión de activos y arrendamiento de infraestructura
Los ingresos por arrendamiento de infraestructura alcanzaron los $ 250 millones en 2023, incluido el derecho de paso y el arrendamiento de equipos de la tubería.
| Categoría de arrendamiento | Ingresos anuales |
|---|---|
| Tubería derecho de paso | $ 150 millones |
| Arrendamiento de equipos | $ 100 millones |
Plains All American Pipeline, L.P. (PAA) - Canvas Business Model: Value Propositions
You're looking at the core strengths Plains All American Pipeline, L.P. offers its partners and the market as of late 2025. It's all about scale and strategic positioning, especially after the recent major acquisition.
Reliable, large-scale crude oil transportation from basin to market
Plains All American Pipeline, L.P. moves a massive amount of product across North America. On average, PAA handles over nine million barrels per day of crude oil and NGL as of October 2025. This throughput is supported by an extensive footprint, including interests in 18,370 miles of active pipelines and gathering systems across key basins and corridors. The Crude Oil segment delivered an Adjusted EBITDA of $559 million in the first quarter of 2025 and $580 million in the second quarter of 2025, showing consistent operational flow despite market noise.
Strategic market access, including egress to the US Gulf Coast via EPIC
The value proposition here is solidified by the recent full control of the EPIC Crude Oil Pipeline. Plains All American Pipeline, L.P. completed the acquisition of 100% equity interest in EPIC Crude Holdings, LP on October 31, 2025. This asset is critical for Gulf Coast egress, linking the Permian and Eagle Ford basins to Corpus Christi. The EPIC system itself brings significant capacity:
- Operating capacity of over 600,000 barrels per day.
- Over 200,000 barrels per day of export capacity at the Corpus Christi Marine Terminal.
- Approximately 7 million barrels of operational storage.
Integrated logistics services (gathering, storage, terminalling) for producers
Plains All American Pipeline, L.P. offers a full suite of services that extend from the wellhead to the market hub. This integration is key to capturing value at every step. For example, the NGL segment enhanced its fee-based cash flow in Canada by placing into service a 30,000 barrel/day fractionation bottleneck project at Fort Saskatchewan. This focus on integration is also evident in the Q1 2025 results, where the NGL Segment Adjusted EBITDA increased by 19% year-over-year, partly due to increased NGL sales volumes.
Stable, fee-based cash flow supported by long-term contracts
The business model is designed for durability, relying on long-term contracts that generate steady revenue streams. This stability is reflected in the overall financial guidance; management narrowed the full-year 2025 Adjusted EBITDA guidance to a range of $2.84 billion to $2.89 billion. The company maintains a disciplined leverage profile, exiting Q2 2025 at a 3.3x leverage ratio, which sits toward the low end of the target range of 3.25x - 3.75x. Furthermore, the expected Distributable Cash Flow per Unit (DCFU) for the full year 2025 is projected to be roughly $2.65, supporting the commitment to unitholders.
Operational efficiency and scale, a premier competitor in the industry
The sheer scale of Plains All American Pipeline, L.P.'s assets provides a cost advantage and operational flexibility that smaller players can't match. The company continues to execute on its bolt-on acquisition strategy, deploying capital to extend and expand this footprint. Here's a snapshot of the scale underpinning these value propositions as of late 2025:
| Metric | Value | Context/Date |
| Total Throughput (Crude & NGL) | Over 9 million barrels per day | As of October 2025 |
| Total Pipeline & Gathering Miles | 18,370 miles | Network size |
| 2025 Full-Year Adjusted EBITDA Guidance | $2.84 billion to $2.89 billion | Narrowed guidance for 2025 |
| Q2 2025 Adjusted EBITDA | $672 million | Second Quarter 2025 result |
| Target Leverage Ratio Range | 3.25x - 3.75x | Target range |
| Reported Leverage Ratio | 3.3x | Exited Q2 2025 |
The strategic shift is clear: the planned divestiture of the NGL business, expected to close by the end of Q1 2026, will result in a more streamlined crude oil midstream entity with less commodity exposure.
Plains All American Pipeline, L.P. (PAA) - Canvas Business Model: Customer Relationships
You're looking at how Plains All American Pipeline, L.P. (PAA) manages the crucial connections with the shippers and off-takers that keep its vast midstream network flowing. The relationships are built on a foundation of long-term commitments, which provide stability, even when commodity markets get choppy.
Dedicated account management for large-volume customers
For the major producers and refiners, Plains All American Pipeline, L.P. deploys dedicated teams. These relationships are essential for moving the massive volumes Plains handles-over 7 million barrels per day of crude oil and NGL through 18,370 miles of active pipelines and gathering systems as of early 2025. The success of these relationships is reflected in the segment performance; for example, Q3 2025 Crude Oil segment adjusted EBITDA was $593 million, benefiting from higher volumes. The company's strategy includes bolt-on acquisitions, such as the recent purchase of a 100% equity interest in EPIC Crude Holdings for approximately $1.3 billion, which expands the footprint and deepens relationships in key basins like the Permian.
Long-term, take-or-pay contracts for pipeline capacity
The stability of Plains All American Pipeline, L.P.'s cash flow is heavily underpinned by long-term contracts. While the exact percentage under take-or-pay terms isn't public, the commitment is clear in growth projects; NGL infrastructure expansions, like the 30,000 barrel/day fractionation bottleneck project at Fort Sask., are explicitly backed by these long-term customer contracts. This structure helps insulate the business, as seen in the NGL segment, where approximately 80% of estimated C3+ spec products sales were hedged for 2025.
Regulated tariffs for transportation services
Transportation services are governed by regulated tariffs, which provide a predictable revenue base. Customer relationships here are managed through adherence to these published rates, though Plains All American Pipeline, L.P. benefits from contractual mechanisms like annual tariff escalation, which contributed to a 1% year-over-year increase in Crude Oil segment adjusted EBITDA in Q1 2025. The Q3 2025 results noted that the segment benefited from the impact of annual tariff escalation.
High-touch commercial engagement for storage and blending services
For storage and blending, the engagement moves beyond simple transportation fees. This requires more direct commercial negotiation to optimize asset utilization. The NGL segment, which includes fractionation and blending, saw its Q1 2025 adjusted EBITDA rise 19% year-over-year, partly due to higher weighted average frac spreads. The company's commitment to capital discipline and strategic M&A, like the acquisition of an additional 20% interest in BridgeTex Pipeline Company, LLC, bringing the total to 40%, is aimed at optimizing these complex service offerings for customers.
Transactional relationships for spot market storage and terminalling
A portion of the business remains opportunistic, relying on short-term market movements for storage and terminalling services. This is where Plains All American Pipeline, L.P. interacts with customers on a spot basis. However, market volatility, such as fewer market opportunities noted in Q2 2025, can impact results. The overall financial performance for 2025 is guided to an Adjusted EBITDA attributable to Plains in the range of $2.84 billion to $2.89 billion, reflecting a mix of stable contract revenue and variable transactional income.
Here's a quick look at the scale of operations that these customer relationships support in 2025:
| Metric | Value (as of 2025 Reporting) | Context |
|---|---|---|
| Full-Year 2025 Adjusted EBITDA Guidance (Narrowed) | $2.84 billion to $2.89 billion | Overall expected earnings from all customer activities |
| Q3 2025 Adjusted EBITDA Attributable to PAA | $669 million | Reflects performance across all customer service types |
| Q1 2025 Crude Oil Segment Adjusted EBITDA | $559 million | Driven by tariff volumes and escalations from pipeline customers |
| Total Bolt-on Acquisitions Year-to-Date (through Q3 2025) | Approximately $800 million | Investment to deepen relationships and expand service areas |
| Leverage Ratio (End of Q1/Q2 2025) | 3.3x | Toward the low-end of the target range of 3.25x - 3.75x |
The nature of these customer interactions drives the capital deployment strategy:
- Growth capital spending for 2025 is projected at approximately $490 million.
- Maintenance capital for 2025 is trending closer to $215 million.
- The company completed 5 bolt-on transactions year-to-date as of Q3 2025.
- The NGL segment hedging protects 80% of estimated C3+ spec products sales for 2025.
Plains All American Pipeline, L.P. (PAA) - Canvas Business Model: Channels
The physical pipelines and gathering systems represent the core channel for Plains All American Pipeline, L.P. (PAA). As of late 2025, Plains All American Pipeline, L.P. handles more than 7 million barrels per day of crude oil and NGL on average through 18,370 miles of active pipelines and gathering systems across key basins and transportation corridors in the United States and Canada. This extensive network is augmented by strategic bolt-on acquisitions; for instance, the acquisition of Black Knight Midstream\'s Permian Basin crude oil gathering business closed effective May 1, 2025, for approximately $55 million. Furthermore, the recent closing of the remaining 45% operating interest in EPIC Crude Holdings for approximately $1.3 billion further solidifies this channel, adding to the approximately 800 miles of pipelines and over 600,000 barrels per day capacity from that system alone. The company expects to generate approximately $870 million of adjusted free cash flow in 2025, which supports the ongoing maintenance and growth of these physical assets. Growth capital spending for the year is expected to be approximately $490 million, with maintenance capital trending closer to $215 million.
Storage terminals and terminalling facilities provide crucial market hubs and operational flexibility. Plains All American Pipeline, L.P. owns storage capacity for about 75 million barrels of crude oil and 28 million barrels of NGLs across its system. The operational storage capacity within the Plains Oryx Permian Basin joint venture alone is approximately ~16.9 million barrels. The EPIC Crude Holdings assets, in which Plains now holds a 100% interest following a September 2025 closing, contribute approximately 7 million barrels of operational storage and over 200,000 barrels per day of export capacity.
For flexible crude oil movement, Plains All American Pipeline, L.P. utilizes truck, barge, and rail logistics, complementing the fixed pipeline infrastructure. This flexibility is essential for connecting supply sources to pipelines or terminals when pipeline capacity is constrained or for serving specific, shorter-haul needs. The company's overall system handles an average of more than 7 million barrels per day of crude oil and NGL, a volume supported by this multimodal logistics capability.
Direct sales teams manage long-term capacity agreements, which underpin the stability of the fee-based cash flow component of the business model. The Crude Oil segment's performance benefits from higher tariff volumes and tariff escalations. For example, the third quarter of 2025 adjusted EBITDA from Crude Oil benefited from higher volumes and contributions from acquisitions, though this was partially offset by certain Permian long-haul contract rates resetting to market in September. A substantial portion of the EPIC pipeline capacity is contracted for the long term, providing revenue visibility.
Electronic Data Interchange (EDI) is used for scheduling and nominations, which is the digital backbone for managing the physical flow through the vast network of pipelines and terminals. While specific 2025 EDI transaction volumes aren't public, this channel is critical for the efficient nomination and scheduling of the millions of barrels per day moved across the system.
Here's a look at key operational and financial metrics relevant to Plains All American Pipeline, L.P.'s Channels as of late 2025:
| Metric Category | Specific Channel/Asset Detail | 2025 Real-Life Number/Amount |
| Physical Network Size | Total Active Pipeline and Gathering Miles | 18,370 miles |
| Throughput Volume | Average Daily Crude Oil and NGL Throughput (Reported) | More than 7 million barrels per day |
| Storage Capacity | Total Owned Crude Oil Storage Capacity (Barrels) | About 75 million barrels |
| Storage Capacity | Total Owned NGL Storage Capacity (Barrels) | 28 million barrels |
| Recent Acquisition Cost | Black Knight Midstream Gathering Business Acquisition | Approximately $55 million |
| Recent Acquisition Cost | EPIC Crude Holdings Remaining 45% Interest | Approximately $1.3 billion |
| Financial Guidance | Narrowed Full-Year 2025 Adjusted EBITDA Guidance | $2.84 billion to $2.89 billion |
| Capital Allocation | Expected Adjusted Free Cash Flow for 2025 | Approximately $870 million |
| Financing Activity | September 2025 Unsecured Note Issuance Total | $1.25 billion |
| Divestiture Value | Agreed Sale Price for Substantially All NGL Business (USD) | $3.75 billion |
The company's operational scale is further detailed by specific asset contributions and financial performance:
- Q1 2025 Net Cash Provided by Operating Activities: $639 million.
- Q1 2025 Adjusted EBITDA Attributable to PAA: $754 million.
- Quarterly Cash Distribution Paid: $0.38 per unit ($1.52 per unit annualized).
- EPIC Pipeline Capacity (55% interest contribution): Over 600,000 barrels per day.
- Debt Issuance Rate (2031 Notes): 4.7%.
- Debt Issuance Rate (2036 Notes): 5.6%.
Plains All American Pipeline, L.P. (PAA) - Canvas Business Model: Customer Segments
You're analyzing Plains All American Pipeline, L.P. (PAA) and need to map out exactly who pays for their midstream services, which is defintely the core of their business. PAA's customer base is diverse, spanning the entire energy supply chain from the wellhead to the market hub, but the focus is clearly shifting.
Major crude oil and natural gas liquids (NGL) producers in the Permian and Eagle Ford
Producers are your primary source of volume, especially now that Plains All American Pipeline, L.P. has aggressively focused on crude oil gathering. The Permian Basin is the engine here; it drives around half of Plains' cash flow. To deepen this relationship, Plains All American Pipeline, L.P. spent heavily in early 2025, making bolt-on acquisitions to expand its crude oil gathering footprint in both the Permian and Eagle Ford basins. For instance, they acquired Ironwood Midstream Energy's Eagle Ford gathering system for approximately $475 million and bought Medallion Midstream's Delaware Basin crude oil gathering business for about $160 million (net to PAA's interest). This strategy is about getting closer to the source. Furthermore, the announced $1.57 billion acquisition of a 55% interest in EPIC Crude Holdings, LP, which includes the EPIC Crude Pipeline linking the Permian and Eagle Ford to Corpus Christi, solidifies their wellhead-to-water strategy with these producers. However, note that Plains All American Pipeline, L.P. is actively exiting the NGL market, agreeing to sell substantially all of its NGL business to Keyera for approximately $3.75 billion USD, with an expected close in the first quarter of 2026. This means the producer relationship is increasingly centered on crude oil takeaway.
Integrated oil companies and independent refiners
Refiners rely on Plains All American Pipeline, L.P. for reliable crude delivery and processing services. In the first quarter of 2025, higher tariff volumes on pipelines and tariff escalations from these customers helped support the Crude Oil Segment Adjusted EBITDA, which was $559 million. By the second quarter of 2025, the Crude Oil Segment Adjusted EBITDA reached $580 million, benefiting sequentially from throughput associated with refiner customers returning from downtime experienced in Q1 2025. The company's infrastructure provides multiple touchpoints to serve these large downstream consumers.
Crude oil marketers and traders
Marketers and traders use Plains All American Pipeline, L.P.'s extensive network for logistics, storage, and merchant activities. The Crude Oil segment provides terminaling, storage, and other related services, alongside merchant activities, which involve buying and selling crude oil. While the Q1 2025 results saw favorable tariff volumes offset by fewer market opportunities, the overall system scale-handling over 7 million barrels per day of crude oil and NGL on average through 18,370 miles of active pipelines and gathering systems-makes Plains a critical counterparty for these trading entities.
Other midstream companies utilizing PAA's interconnects
This segment involves partnerships and joint ventures where other midstream players connect into Plains All American Pipeline, L.P.'s assets to move their volumes. A concrete example is the Plains Oryx Permian Basin LLC joint venture, which acquired a piece of Medallion Midstream's Delaware Basin business. Also, Plains acquired an additional 20% interest in BridgeTex Pipeline Company, LLC in July 2025, bringing their total stake to 40%, indicating ongoing optimization and integration with other midstream infrastructure owners. These interconnects allow for optimization across basins, like the Cheyenne Pipeline acquisition in the Rockies, which enhanced integration from the Guernsey market to pipelines supplying Cushing, Oklahoma, closing effective February 28, 2025.
Institutional investors seeking stable distributions from an MLP
For institutional investors, the primary draw is the Master Limited Partnership (MLP) structure, which emphasizes distributions. Plains All American Pipeline, L.P. reaffirmed its quarterly cash distribution for Q3 2025 at $0.38 per common unit, which annualizes to $1.52 per unit. The projected full-year 2025 Distributable Cash Flow (DCFU) is $2.65 per unit, meaning the expected payout ratio is roughly 57% of EPS, which management views as sustainable. The company's leverage ratio stood at 3.3x as of June 30, 2025, which is toward the low-end of their target range of 3.25x to 3.75x, signaling balance sheet flexibility that supports the distribution. The firm's BBB- credit rating also plays a role in attracting this investor class.
Here's a quick snapshot of the financial context that frames these customer relationships as of late 2025:
| Metric | Value (as of late 2025) | Context/Period |
| Twelve Months Revenue (TTM) | $47.096 billion | Ending September 30, 2025 |
| Full-Year 2025 Adj. EBITDA Guidance (Midpoint) | $2.875 billion | Midpoint of $2.80B to $2.95B range |
| Q2 2025 Adjusted EBITDA (Attributable to PAA) | $672 million | Second Quarter 2025 |
| Projected Full-Year 2025 DCFU | $2.65 per unit | 2025 Estimate |
| Annualized Distribution Rate | $1.52 per unit | As of Q3 2025 |
| Leverage Ratio (Debt-to-EBITDA) | 3.3x | As of June 30, 2025 |
| Permian Cash Flow Contribution | Around half | Of total cash flow |
The core value proposition for producers is reliable takeaway capacity, especially in the Permian, while for investors, it's the commitment to maintaining the $1.52 annualized distribution, supported by a leverage ratio near the low end of the target.
Plains All American Pipeline, L.P. (PAA) - Canvas Business Model: Cost Structure
You're analyzing the cost structure for Plains All American Pipeline, L.P. (PAA), which is heavily weighted toward owning and maintaining massive, long-lived energy infrastructure. This means fixed costs dominate the picture, as the pipelines and terminals represent sunk capital that must be maintained regardless of immediate throughput volumes.
The ownership of over 18,370 miles of active pipelines is the primary driver of these high fixed costs. For the twelve months ending September 30, 2025, Plains All American Pipeline, L.P. reported total revenue of approximately $47.096 billion, but the cost to keep that network operating is substantial.
Capital spending is a major component, split between keeping the lights on and funding growth projects. For the 2025 fiscal year, growth capital spending is expected to be approximately $490 million, which is slightly up from earlier forecasts due to new lease connects and acquisition-related capital. Also, maintenance capital expenditures are trending closer to $215 million for 2025, representing a slight decrease from the prior forecast. Honestly, these figures show management is balancing system upkeep with strategic investment.
Here's a quick look at the planned capital deployment and the debt load that generates interest expense:
| Cost Category | 2025 Estimated/Reported Amount | Context/Notes |
| Growth Capital Expenditures | $490 million | For the full year 2025, including bolt-on acquisition capital. |
| Maintenance Capital Expenditures | Around $215 million | Trending for the 2025 fiscal year. |
| Long-Term Debt (Approximate) | $7-8 billion | Level on the balance sheet as of late 2025. |
| Interest Expense (Quarterly Trend) | $110M-$135M per quarter | Reflects financing costs on elevated long-term debt. |
Operating expenses include the costs associated with running the system, which Plains All American Pipeline, L.P. noted were higher in the first quarter of 2025, offsetting some tariff volume gains. For the fiscal quarter ending in September of 2025, reported Operating Expenses reached $11.19 billion. While specific line items for pipeline integrity and power consumption aren't broken out for 2025 in the latest reports, historical context suggests utility costs and integrity activities are significant drivers, with past increases linked to higher prices and power hedges.
Financing costs are material due to the capital-intensive nature of the business. Plains All American Pipeline, L.P. bolstered its balance sheet in September 2025 by issuing $1.25 billion of senior unsecured notes, split into a $700 million tranche due in 2031 at a 4.7% rate and a $550 million tranche due in 2036 at a 5.6% rate. This new debt contributes to the quarterly interest expense that typically falls between $110 million and $135 million. The company's Debt-to-EBITDA leverage ratio was sitting at 3.3x in Q2 2025, which is toward the low end of their target range of 3.25x to 3.75x.
You should track these key operational costs:
- Higher operating expenses offset tariff volume benefits in Q1 2025.
- Past increases in field operating costs were tied to unrealized mark-to-market losses on power hedges.
- Total Assets for Plains All American Pipeline, L.P. are in the mid-$28B range.
Finance: draft 13-week cash view by Friday.
Plains All American Pipeline, L.P. (PAA) - Canvas Business Model: Revenue Streams
You're looking at the core ways Plains All American Pipeline, L.P. brings in cash as of late 2025. The model is heavily weighted toward stable, fee-based contracts, which is what you want to see in a midstream operator, especially as they streamline the business.
The primary engine remains the transportation of crude oil. This revenue is secured through long-term contracts, which means Plains All American Pipeline, L.P. gets paid based on volume moved or capacity reserved, not fluctuating commodity prices. This is the essence of the fee-based revenue from crude oil pipeline tariffs and throughput commitments.
For context on the scale of operations feeding these streams, Plains All American Pipeline, L.P. reported revenue of $11.58 billion for the quarter ended September 30, 2025. The Crude Oil segment's performance in Q1 2025 showed the strength of this model, benefiting from:
- Higher tariff volumes on pipelines.
- Tariff escalations.
- Contributions from recently completed bolt-on acquisitions.
Storage and terminalling fees from capacity reservations provide another layer of stable income. This revenue comes from customers reserving space in Plains All American Pipeline, L.P.'s vast network of storage tanks and terminals, regardless of whether they are actively flowing product at maximum capacity every day. The company has been investing in this area, evidenced by capital spending associated with Permian terminal expansions.
The NGL business, while still contributing revenue in 2025, is in a transition phase. Plains All American Pipeline, L.P. announced the execution of definitive agreements in June 2025 to sell substantially all of its NGL business, with an expected close in the first quarter of 2026. Prior to this, revenue from NGL fractionation and sales was a component. For example, in Q1 2025, the NGL segment saw adjusted EBITDA helped by higher frac spreads and NGL sales volumes. The company had also launched a 30,000 barrel/day fractionation project, backed by long-term customer contracts, aligning with its growth strategy before the divestiture.
To give you a high-level view of expected full-year profitability, Plains All American Pipeline, L.P. narrowed its full-year 2025 Adjusted EBITDA guidance to $2.84 billion to $2.89 billion as of early November 2025. Analysts, looking ahead, had a consensus estimate for full-year 2025 earnings per share of $1.52. Here's a quick look at the guidance context:
| Metric | Value/Range | Context/Date |
|---|---|---|
| Full-Year 2025 Adjusted EBITDA Guidance (Narrowed) | $2.84 billion to $2.89 billion | As of November 2025 |
| Q3 2025 Revenue | $11.58 billion | Actual result |
| Analyst Consensus EPS Estimate for Full-Year 2025 | $1.52 | As of late 2025 |
| NGL Business Sale Expected Close | Q1 2026 | Expected closing timeframe |
The focus is clearly shifting to a more streamlined crude oil midstream entity, meaning the fee-based tariff and storage revenue will become the overwhelming majority of the top line post-Q1 2026. That's the play here; less commodity price volatility flowing through the P&L.
Disclaimer
All information, articles, and product details provided on this website are for general informational and educational purposes only. We do not claim any ownership over, nor do we intend to infringe upon, any trademarks, copyrights, logos, brand names, or other intellectual property mentioned or depicted on this site. Such intellectual property remains the property of its respective owners, and any references here are made solely for identification or informational purposes, without implying any affiliation, endorsement, or partnership.
We make no representations or warranties, express or implied, regarding the accuracy, completeness, or suitability of any content or products presented. Nothing on this website should be construed as legal, tax, investment, financial, medical, or other professional advice. In addition, no part of this site—including articles or product references—constitutes a solicitation, recommendation, endorsement, advertisement, or offer to buy or sell any securities, franchises, or other financial instruments, particularly in jurisdictions where such activity would be unlawful.
All content is of a general nature and may not address the specific circumstances of any individual or entity. It is not a substitute for professional advice or services. Any actions you take based on the information provided here are strictly at your own risk. You accept full responsibility for any decisions or outcomes arising from your use of this website and agree to release us from any liability in connection with your use of, or reliance upon, the content or products found herein.