
|
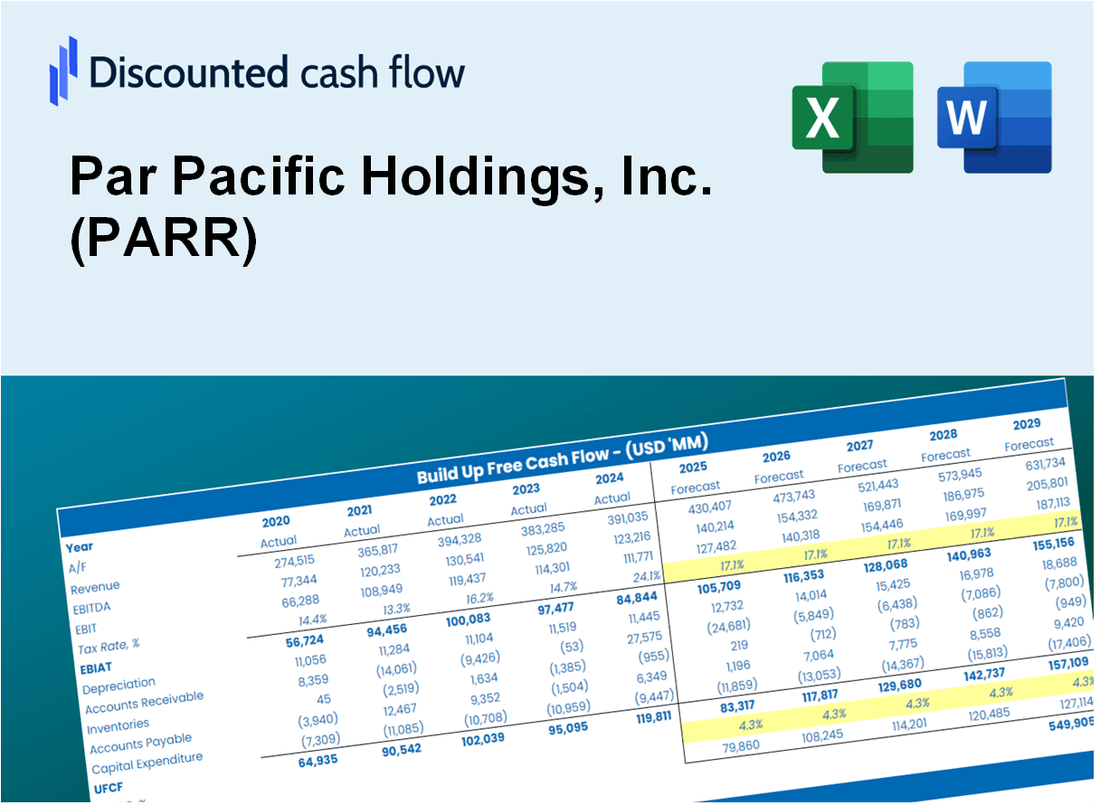
Valoración DCF de Par Pacific Holdings, Inc. (PARR) |
Completamente Editable: Adáptelo A Sus Necesidades En Excel O Sheets
Diseño Profesional: Plantillas Confiables Y Estándares De La Industria
Predeterminadas Para Un Uso Rápido Y Eficiente
Compatible con MAC / PC, completamente desbloqueado
No Se Necesita Experiencia; Fáciles De Seguir
Par Pacific Holdings, Inc. (PARR) Bundle
¡Explore las perspectivas financieras de Par Pacific Holdings, Inc. (PARR) con nuestra calculadora DCF fácil de usar! Ingrese sus suposiciones con respecto al crecimiento, los márgenes de beneficio y los gastos para calcular el valor intrínseco de Pacific Holdings, Inc. (PARR) y mejorar su enfoque de inversión.
Discounted Cash Flow (DCF) - (USD MM)
| Year | AY1 2020 |
AY2 2021 |
AY3 2022 |
AY4 2023 |
AY5 2024 |
FY1 2025 |
FY2 2026 |
FY3 2027 |
FY4 2028 |
FY5 2029 |
|---|---|---|---|---|---|---|---|---|---|---|
| Revenue | 3,124.9 | 4,710.1 | 7,321.8 | 8,232.0 | 7,974.5 | 10,276.7 | 13,243.6 | 17,067.1 | 21,994.4 | 28,344.2 |
| Revenue Growth, % | 0 | 50.73 | 55.45 | 12.43 | -3.13 | 28.87 | 28.87 | 28.87 | 28.87 | 28.87 |
| EBITDA | -271.8 | 80.6 | 542.2 | 805.6 | 176.2 | 255.1 | 328.8 | 423.7 | 546.0 | 703.7 |
| EBITDA, % | -8.7 | 1.71 | 7.41 | 9.79 | 2.21 | 2.48 | 2.48 | 2.48 | 2.48 | 2.48 |
| Depreciation | 90.0 | 94.2 | 99.8 | 119.8 | 131.6 | 192.2 | 247.7 | 319.2 | 411.3 | 530.1 |
| Depreciation, % | 2.88 | 2 | 1.36 | 1.46 | 1.65 | 1.87 | 1.87 | 1.87 | 1.87 | 1.87 |
| EBIT | -361.8 | -13.7 | 442.5 | 685.8 | 44.6 | 62.9 | 81.1 | 104.5 | 134.7 | 173.6 |
| EBIT, % | -11.58 | -0.29042 | 6.04 | 8.33 | 0.55892 | 0.61244 | 0.61244 | 0.61244 | 0.61244 | 0.61244 |
| Total Cash | 68.3 | 112.2 | 490.9 | 279.1 | 191.9 | 350.9 | 452.2 | 582.7 | 750.9 | 967.7 |
| Total Cash, percent | .0 | .0 | .0 | .0 | .0 | .0 | .0 | .0 | .0 | .0 |
| Account Receivables | 111.7 | 195.1 | 252.9 | 367.2 | 398.1 | 423.9 | 546.3 | 704.0 | 907.2 | 1,169.1 |
| Account Receivables, % | 3.57 | 4.14 | 3.45 | 4.46 | 4.99 | 4.12 | 4.12 | 4.12 | 4.12 | 4.12 |
| Inventories | 429.9 | 790.3 | 1,042.0 | 1,225.9 | 1,089.3 | 1,507.0 | 1,942.0 | 2,502.7 | 3,225.2 | 4,156.3 |
| Inventories, % | 13.76 | 16.78 | 14.23 | 14.89 | 13.66 | 14.66 | 14.66 | 14.66 | 14.66 | 14.66 |
| Accounts Payable | 106.9 | 154.5 | 151.4 | 391.3 | 436.8 | 390.6 | 503.3 | 648.6 | 835.9 | 1,077.2 |
| Accounts Payable, % | 3.42 | 3.28 | 2.07 | 4.75 | 5.48 | 3.8 | 3.8 | 3.8 | 3.8 | 3.8 |
| Capital Expenditure | -63.5 | -29.5 | -53.0 | -82.3 | -135.5 | -125.0 | -161.1 | -207.6 | -267.6 | -344.8 |
| Capital Expenditure, % | -2.03 | -0.62702 | -0.72421 | -0.99948 | -1.7 | -1.22 | -1.22 | -1.22 | -1.22 | -1.22 |
| Tax Rate, % | 14.6 | 14.6 | 14.6 | 14.6 | 14.6 | 14.6 | 14.6 | 14.6 | 14.6 | 14.6 |
| EBITAT | -344.4 | -13.9 | 441.6 | 814.7 | 38.1 | 60.5 | 77.9 | 100.4 | 129.4 | 166.8 |
| Depreciation | ||||||||||
| Changes in Account Receivables | ||||||||||
| Changes in Inventories | ||||||||||
| Changes in Accounts Payable | ||||||||||
| Capital Expenditure | ||||||||||
| UFCF | -752.5 | -345.5 | 175.7 | 793.9 | 185.3 | -362.0 | -280.2 | -361.1 | -465.4 | -599.7 |
| WACC, % | 8.84 | 8.95 | 8.94 | 8.95 | 8.61 | 8.86 | 8.86 | 8.86 | 8.86 | 8.86 |
| PV UFCF | ||||||||||
| SUM PV UFCF | -1,572.7 | |||||||||
| Long Term Growth Rate, % | 0.50 | |||||||||
| Free cash flow (T + 1) | -603 | |||||||||
| Terminal Value | -7,212 | |||||||||
| Present Terminal Value | -4,718 | |||||||||
| Enterprise Value | -6,291 | |||||||||
| Net Debt | 1,375 | |||||||||
| Equity Value | -7,666 | |||||||||
| Diluted Shares Outstanding, MM | 57 | |||||||||
| Equity Value Per Share | -135.02 |
What You Will Get
- Editable Excel Template: A fully customizable Excel-based DCF Calculator featuring pre-filled real PARR financials.
- Real-World Data: Historical data and forward-looking estimates (as indicated in the yellow cells).
- Forecast Flexibility: Adjust forecast assumptions such as revenue growth, EBITDA %, and WACC.
- Automatic Calculations: Instantly observe the effect of your inputs on Par Pacific Holdings' valuation.
- Professional Tool: Designed for investors, CFOs, consultants, and financial analysts.
- User-Friendly Design: Organized for clarity and ease of use, complete with step-by-step instructions.
Key Features
- 🔍 Real-Life PARR Financials: Pre-filled historical and projected data for Par Pacific Holdings, Inc. (PARR).
- ✏️ Fully Customizable Inputs: Adjust all critical parameters (yellow cells) like WACC, growth %, and tax rates.
- 📊 Professional DCF Valuation: Built-in formulas calculate Par Pacific's intrinsic value using the Discounted Cash Flow method.
- ⚡ Instant Results: Visualize Par Pacific's valuation instantly after making changes.
- Scenario Analysis: Test and compare outcomes for various financial assumptions side-by-side.
How It Works
- Step 1: Download the prebuilt Excel template featuring Par Pacific Holdings, Inc. (PARR) data.
- Step 2: Review the pre-filled sheets to familiarize yourself with the essential metrics.
- Step 3: Modify forecasts and assumptions in the editable yellow cells (WACC, growth, margins).
- Step 4: Instantly see the recalculated results, including Par Pacific Holdings, Inc. (PARR)'s intrinsic value.
- Step 5: Utilize the outputs to make informed investment choices or create comprehensive reports.
Why Choose Par Pacific Holdings, Inc. (PARR)?
- Save Time: Quickly access essential financial metrics without building complex models.
- Enhance Precision: Utilize dependable data and methodologies to minimize valuation inaccuracies.
- Completely Customizable: Adjust the framework to align with your specific forecasts and insights.
- User-Friendly: Intuitive visuals and outputs simplify data interpretation and decision-making.
- Endorsed by Professionals: Crafted for industry experts who prioritize accuracy and functionality.
Who Should Use This Product?
- Professional Investors: Develop comprehensive and accurate valuation models for analyzing Par Pacific Holdings, Inc. (PARR).
- Corporate Finance Teams: Evaluate valuation scenarios to inform strategic decisions within the organization.
- Consultants and Advisors: Deliver precise valuation insights to clients interested in Par Pacific Holdings, Inc. (PARR).
- Students and Educators: Utilize real-world data to enhance learning and practice in financial modeling.
- Energy Sector Enthusiasts: Gain insights into how companies like Par Pacific Holdings, Inc. (PARR) are valued in the energy market.
What the Template Contains
- Operating and Balance Sheet Data: Pre-filled Par Pacific Holdings, Inc. (PARR) historical data and forecasts, including revenue, EBITDA, EBIT, and capital expenditures.
- WACC Calculation: A dedicated sheet for Weighted Average Cost of Capital (WACC), including parameters like Beta, risk-free rate, and share price.
- DCF Valuation (Unlevered and Levered): Editable Discounted Cash Flow models showing intrinsic value with detailed calculations.
- Financial Statements: Pre-loaded financial statements (annual and quarterly) to support analysis.
- Key Ratios: Includes profitability, leverage, and efficiency ratios for Par Pacific Holdings, Inc. (PARR).
- Dashboard and Charts: Visual summary of valuation outputs and assumptions to analyze results easily.
Disclaimer
All information, articles, and product details provided on this website are for general informational and educational purposes only. We do not claim any ownership over, nor do we intend to infringe upon, any trademarks, copyrights, logos, brand names, or other intellectual property mentioned or depicted on this site. Such intellectual property remains the property of its respective owners, and any references here are made solely for identification or informational purposes, without implying any affiliation, endorsement, or partnership.
We make no representations or warranties, express or implied, regarding the accuracy, completeness, or suitability of any content or products presented. Nothing on this website should be construed as legal, tax, investment, financial, medical, or other professional advice. In addition, no part of this site—including articles or product references—constitutes a solicitation, recommendation, endorsement, advertisement, or offer to buy or sell any securities, franchises, or other financial instruments, particularly in jurisdictions where such activity would be unlawful.
All content is of a general nature and may not address the specific circumstances of any individual or entity. It is not a substitute for professional advice or services. Any actions you take based on the information provided here are strictly at your own risk. You accept full responsibility for any decisions or outcomes arising from your use of this website and agree to release us from any liability in connection with your use of, or reliance upon, the content or products found herein.