
|
Valoración DCF de PAVmed Inc. (PAVM) |
Completamente Editable: Adáptelo A Sus Necesidades En Excel O Sheets
Diseño Profesional: Plantillas Confiables Y Estándares De La Industria
Predeterminadas Para Un Uso Rápido Y Eficiente
Compatible con MAC / PC, completamente desbloqueado
No Se Necesita Experiencia; Fáciles De Seguir
PAVmed Inc. (PAVM) Bundle
Como inversionista o analista, esta calculadora DCF Pavmed Inc. (PAVM) es su recurso de referencia para una valoración precisa. Cargados con datos reales de Pavmed Inc., puede ajustar los pronósticos y observar instantáneamente sus efectos.
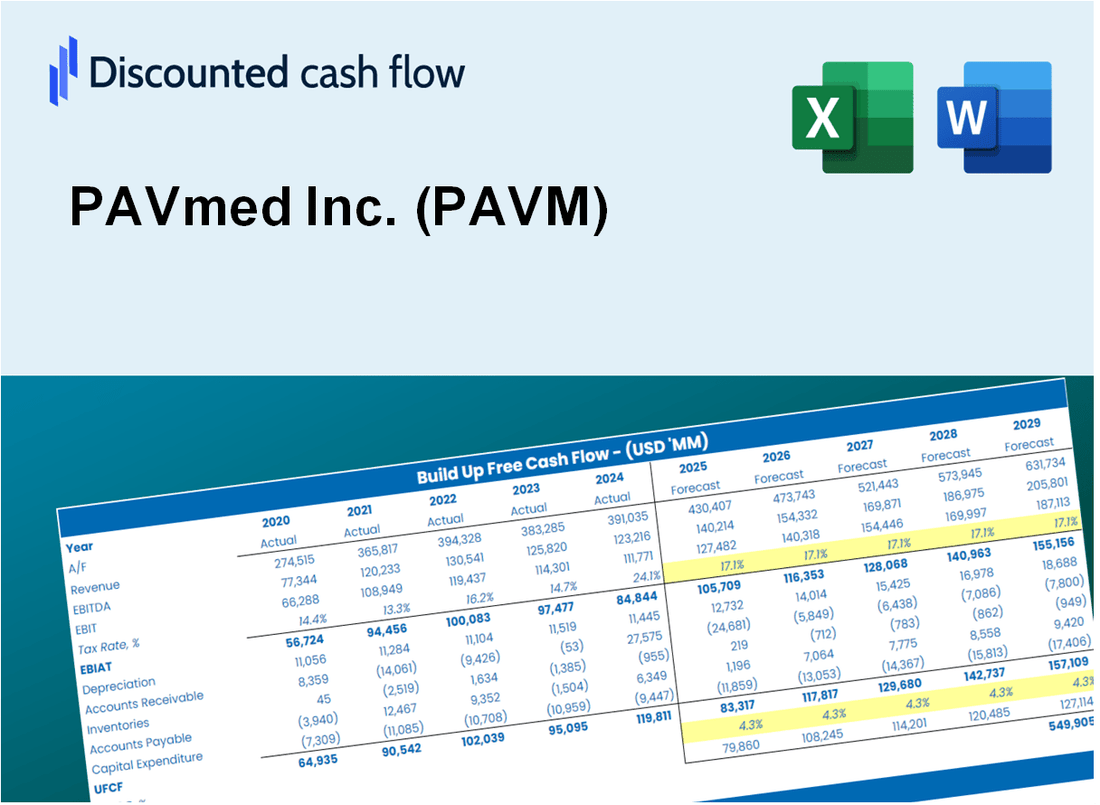
Discounted Cash Flow (DCF) - (USD MM)
| Year | AY1 2020 |
AY2 2021 |
AY3 2022 |
AY4 2023 |
AY5 2024 |
FY1 2025 |
FY2 2026 |
FY3 2027 |
FY4 2028 |
FY5 2029 |
|---|---|---|---|---|---|---|---|---|---|---|
| Revenue | .0 | .5 | .4 | 2.5 | 3.0 | 3.7 | 4.6 | 5.8 | 7.2 | 8.9 |
| Revenue Growth, % | 0 | 0 | -24.6 | 550.4 | 22.15 | 24.39 | 24.39 | 24.39 | 24.39 | 24.39 |
| EBITDA | -23.3 | -55.9 | -99.5 | -75.7 | 29.7 | -.7 | -.9 | -1.2 | -1.4 | -1.8 |
| EBITDA, % | 100 | -11180 | -26392.57 | -3088.99 | 990.65 | -20 | -20 | -20 | -20 | -20 |
| Depreciation | .0 | .2 | 2.5 | 2.9 | 1.2 | 2.9 | 3.6 | 4.4 | 5.5 | 6.9 |
| Depreciation, % | 100 | 45.2 | 651.72 | 119.58 | 40 | 77.04 | 77.04 | 77.04 | 77.04 | 77.04 |
| EBIT | -23.4 | -56.1 | -102.0 | -78.7 | 28.5 | -.7 | -.9 | -1.2 | -1.4 | -1.8 |
| EBIT, % | 100 | -11225.2 | -27044.3 | -3208.56 | 950.65 | -20 | -20 | -20 | -20 | -20 |
| Total Cash | 17.5 | 79.2 | 42.7 | 19.6 | 1.2 | 3.3 | 4.1 | 5.1 | 6.3 | 7.8 |
| Total Cash, percent | .0 | .0 | .0 | .0 | .0 | .0 | .0 | .0 | .0 | .0 |
| Account Receivables | .0 | .2 | .0 | .1 | .0 | 1.1 | 1.4 | 1.7 | 2.1 | 2.6 |
| Account Receivables, % | 100 | 40 | 4.51 | 2.49 | 0.601 | 29.52 | 29.52 | 29.52 | 29.52 | 29.52 |
| Inventories | .9 | .5 | .3 | .5 | .3 | 2.2 | 2.8 | 3.5 | 4.3 | 5.4 |
| Inventories, % | 100 | 105.2 | 69.23 | 21.98 | 8.88 | 60.02 | 60.02 | 60.02 | 60.02 | 60.02 |
| Accounts Payable | 3.0 | 3.3 | 2.7 | 1.8 | .7 | 2.9 | 3.7 | 4.6 | 5.7 | 7.0 |
| Accounts Payable, % | 100 | 659.8 | 717.24 | 72.84 | 21.94 | 78.96 | 78.96 | 78.96 | 78.96 | 78.96 |
| Capital Expenditure | -.1 | -1.5 | -1.5 | -.2 | -.1 | -1.6 | -2.0 | -2.4 | -3.0 | -3.8 |
| Capital Expenditure, % | 100 | -293.8 | -408.49 | -9.87 | -1.84 | -42.34 | -42.34 | -42.34 | -42.34 | -42.34 |
| Tax Rate, % | -39.98 | -39.98 | -39.98 | -39.98 | -39.98 | -39.98 | -39.98 | -39.98 | -39.98 | -39.98 |
| EBITAT | -22.3 | -50.3 | -87.9 | -63.7 | 39.9 | -.7 | -.8 | -1.0 | -1.3 | -1.6 |
| Depreciation | ||||||||||
| Changes in Account Receivables | ||||||||||
| Changes in Inventories | ||||||||||
| Changes in Accounts Payable | ||||||||||
| Capital Expenditure | ||||||||||
| UFCF | -20.2 | -51.1 | -87.1 | -62.2 | 40.2 | -.1 | .7 | .8 | 1.0 | 1.3 |
| WACC, % | 5.67 | 5.54 | 5.46 | 5.34 | 5.77 | 5.56 | 5.56 | 5.56 | 5.56 | 5.56 |
| PV UFCF | ||||||||||
| SUM PV UFCF | 3.0 | |||||||||
| Long Term Growth Rate, % | 2.00 | |||||||||
| Free cash flow (T + 1) | 1 | |||||||||
| Terminal Value | 37 | |||||||||
| Present Terminal Value | 28 | |||||||||
| Enterprise Value | 31 | |||||||||
| Net Debt | 31 | |||||||||
| Equity Value | 1 | |||||||||
| Diluted Shares Outstanding, MM | 65 | |||||||||
| Equity Value Per Share | 0.01 |
What You Will Receive
- Customizable Excel Template: A fully adjustable Excel-based DCF Calculator featuring pre-filled real PAVM financials.
- Authentic Data: Historical data and forward-looking estimates (highlighted in the yellow cells).
- Assumption Flexibility: Modify forecast assumptions such as revenue growth, EBITDA %, and WACC.
- Instant Calculations: Quickly observe how your inputs affect PAVmed Inc.'s valuation.
- Professional Resource: Designed for investors, CFOs, consultants, and financial analysts.
- User-Centric Design: Organized for clarity and ease of navigation, complete with step-by-step guidance.
Key Features
- Customizable Financial Inputs: Adjust essential parameters such as revenue projections, gross margins, and R&D expenses.
- Instant DCF Valuation: Quickly computes intrinsic value, net present value (NPV), and additional financial metrics.
- High-Precision Results: Leverages PAVmed Inc.'s (PAVM) actual financial data for accurate valuation insights.
- Effortless Scenario Testing: Easily evaluate various assumptions and analyze different outcomes.
- Efficiency Booster: Streamline the valuation process without the hassle of creating intricate models from the ground up.
How It Works
- Download the Template: Gain immediate access to the Excel-based PAVmed Inc. DCF Calculator.
- Input Your Assumptions: Modify the yellow-highlighted cells for growth projections, WACC, profit margins, and additional parameters.
- Instant Calculations: The model automatically recalculates PAVmed Inc.'s intrinsic value.
- Test Scenarios: Experiment with various assumptions to assess potential changes in valuation.
- Analyze and Decide: Utilize the findings to inform your investment or financial evaluation.
Why Choose This Calculator for PAVmed Inc. (PAVM)?
- Accurate Data: Up-to-date financials for PAVmed Inc. ensure trustworthy valuation outcomes.
- Customizable: Tailor key inputs such as growth rates, WACC, and tax rates to align with your forecasts.
- Time-Saving: Pre-configured calculations save you from starting from the ground up.
- Professional-Grade Tool: Crafted for investors, analysts, and consultants focused on PAVmed Inc. (PAVM).
- User-Friendly: An intuitive design and guided instructions make it accessible for all users.
Who Should Use This Product?
- Individual Investors: Make informed decisions about buying or selling PAVmed Inc. (PAVM) stock.
- Financial Analysts: Streamline valuation processes with ready-to-use financial models for PAVmed Inc. (PAVM).
- Consultants: Deliver professional valuation insights on PAVmed Inc. (PAVM) to clients quickly and accurately.
- Business Owners: Understand how innovative companies like PAVmed Inc. (PAVM) are valued to guide your own strategy.
- Finance Students: Learn valuation techniques using real-world data and scenarios related to PAVmed Inc. (PAVM).
What the Template Contains
- Historical Data: Includes PAVmed Inc.'s (PAVM) past financials and baseline forecasts.
- DCF and Levered DCF Models: Detailed templates to calculate PAVmed Inc.'s (PAVM) intrinsic value.
- WACC Sheet: Pre-built calculations for Weighted Average Cost of Capital.
- Editable Inputs: Modify key drivers like growth rates, EBITDA %, and CAPEX assumptions.
- Quarterly and Annual Statements: A complete breakdown of PAVmed Inc.'s (PAVM) financials.
- Interactive Dashboard: Visualize valuation results and projections dynamically.
Disclaimer
All information, articles, and product details provided on this website are for general informational and educational purposes only. We do not claim any ownership over, nor do we intend to infringe upon, any trademarks, copyrights, logos, brand names, or other intellectual property mentioned or depicted on this site. Such intellectual property remains the property of its respective owners, and any references here are made solely for identification or informational purposes, without implying any affiliation, endorsement, or partnership.
We make no representations or warranties, express or implied, regarding the accuracy, completeness, or suitability of any content or products presented. Nothing on this website should be construed as legal, tax, investment, financial, medical, or other professional advice. In addition, no part of this site—including articles or product references—constitutes a solicitation, recommendation, endorsement, advertisement, or offer to buy or sell any securities, franchises, or other financial instruments, particularly in jurisdictions where such activity would be unlawful.
All content is of a general nature and may not address the specific circumstances of any individual or entity. It is not a substitute for professional advice or services. Any actions you take based on the information provided here are strictly at your own risk. You accept full responsibility for any decisions or outcomes arising from your use of this website and agree to release us from any liability in connection with your use of, or reliance upon, the content or products found herein.