
|
Pitney Bowes Inc. NT 43 (PBI-PB) DCF Valoración |
Completamente Editable: Adáptelo A Sus Necesidades En Excel O Sheets
Diseño Profesional: Plantillas Confiables Y Estándares De La Industria
Predeterminadas Para Un Uso Rápido Y Eficiente
Compatible con MAC / PC, completamente desbloqueado
No Se Necesita Experiencia; Fáciles De Seguir
Pitney Bowes Inc. NT 43 (PBI-PB) Bundle
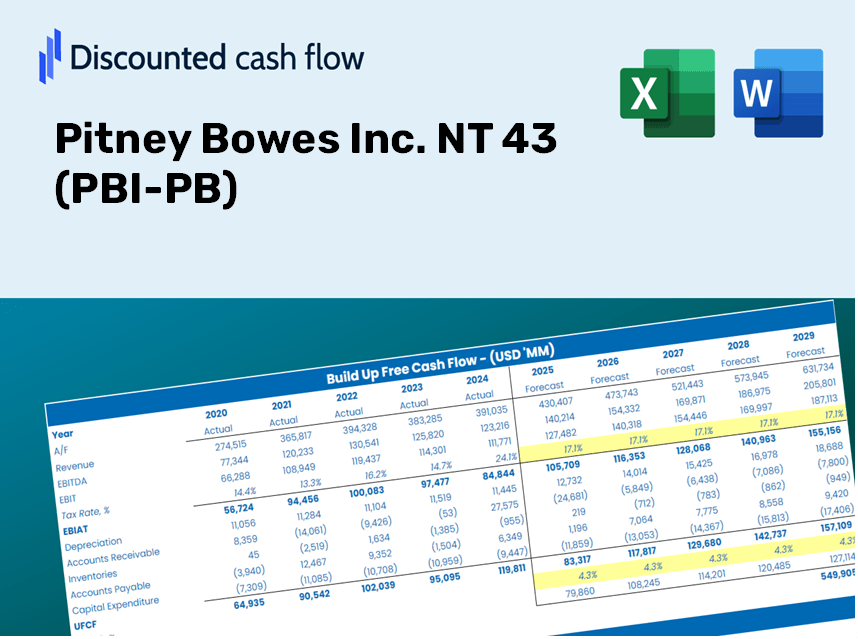
¡Obtenga información sobre su análisis de valoración de Pitney Bowes Inc. NT 43 (PBI-PB) con nuestra potente calculadora DCF! Prelabastado con datos reales (PBI-PB), esta plantilla de Excel le permite ajustar los pronósticos y supuestos para determinar con precisión el valor intrínseco de Pitney Bowes.
Discounted Cash Flow (DCF) - (USD MM)
| Year | AY1 2020 |
AY2 2021 |
AY3 2022 |
AY4 2023 |
AY5 2024 |
FY1 2025 |
FY2 2026 |
FY3 2027 |
FY4 2028 |
FY5 2029 |
|---|---|---|---|---|---|---|---|---|---|---|
| Revenue | 3,554.1 | 3,673.6 | 3,538.0 | 3,266.3 | 2,026.6 | 1,793.7 | 1,587.6 | 1,405.2 | 1,243.7 | 1,100.8 |
| Revenue Growth, % | 0 | 3.36 | -3.69 | -7.68 | -37.96 | -11.49 | -11.49 | -11.49 | -11.49 | -11.49 |
| EBITDA | 83.0 | 299.4 | 491.6 | -135.9 | 172.3 | 103.0 | 91.2 | 80.7 | 71.4 | 63.2 |
| EBITDA, % | 2.34 | 8.15 | 13.89 | -4.16 | 8.5 | 5.74 | 5.74 | 5.74 | 5.74 | 5.74 |
| Depreciation | 160.6 | 162.9 | 163.8 | 160.4 | 114.5 | 86.6 | 76.7 | 67.9 | 60.1 | 53.2 |
| Depreciation, % | 4.52 | 4.43 | 4.63 | 4.91 | 5.65 | 4.83 | 4.83 | 4.83 | 4.83 | 4.83 |
| EBIT | -77.6 | 136.5 | 327.7 | -296.3 | 57.8 | 16.4 | 14.5 | 12.9 | 11.4 | 10.1 |
| EBIT, % | -2.18 | 3.72 | 9.26 | -9.07 | 2.85 | 0.91477 | 0.91477 | 0.91477 | 0.91477 | 0.91477 |
| Total Cash | 940.4 | 746.9 | 681.2 | 623.2 | 486.1 | 391.4 | 346.5 | 306.6 | 271.4 | 240.2 |
| Total Cash, percent | .0 | .0 | .0 | .0 | .0 | .0 | .0 | .0 | .0 | .0 |
| Account Receivables | 980.5 | 909.2 | 917.3 | 906.3 | 706.0 | 505.3 | 447.2 | 395.8 | 350.4 | 310.1 |
| Account Receivables, % | 27.59 | 24.75 | 25.93 | 27.75 | 34.84 | 28.17 | 28.17 | 28.17 | 28.17 | 28.17 |
| Inventories | 71.5 | 78.6 | 83.7 | 70.1 | 59.8 | 41.7 | 36.9 | 32.6 | 28.9 | 25.6 |
| Inventories, % | 2.01 | 2.14 | 2.37 | 2.14 | 2.95 | 2.32 | 2.32 | 2.32 | 2.32 | 2.32 |
| Accounts Payable | 295.2 | 311.0 | 315.4 | 282.4 | 239.7 | 165.6 | 146.6 | 129.7 | 114.8 | 101.6 |
| Accounts Payable, % | 8.31 | 8.47 | 8.91 | 8.65 | 11.83 | 9.23 | 9.23 | 9.23 | 9.23 | 9.23 |
| Capital Expenditure | -105.0 | -184.0 | -124.8 | -102.9 | -72.4 | -65.3 | -57.8 | -51.2 | -45.3 | -40.1 |
| Capital Expenditure, % | -2.95 | -5.01 | -3.53 | -3.15 | -3.57 | -3.64 | -3.64 | -3.64 | -3.64 | -3.64 |
| Tax Rate, % | -289.09 | -289.09 | -289.09 | -289.09 | -289.09 | -289.09 | -289.09 | -289.09 | -289.09 | -289.09 |
| EBITAT | -76.3 | -64.6 | 303.6 | -281.1 | 224.8 | 12.7 | 11.2 | 9.9 | 8.8 | 7.8 |
| Depreciation | ||||||||||
| Changes in Account Receivables | ||||||||||
| Changes in Inventories | ||||||||||
| Changes in Accounts Payable | ||||||||||
| Capital Expenditure | ||||||||||
| UFCF | -777.5 | -5.7 | 333.7 | -231.9 | 434.7 | 178.7 | 73.9 | 65.4 | 57.9 | 51.2 |
| WACC, % | 7.37 | 4.46 | 7.2 | 7.27 | 7.42 | 6.75 | 6.75 | 6.75 | 6.75 | 6.75 |
| PV UFCF | ||||||||||
| SUM PV UFCF | 367.4 | |||||||||
| Long Term Growth Rate, % | 3.50 | |||||||||
| Free cash flow (T + 1) | 53 | |||||||||
| Terminal Value | 1,633 | |||||||||
| Present Terminal Value | 1,178 | |||||||||
| Enterprise Value | 1,545 | |||||||||
| Net Debt | 1,578 | |||||||||
| Equity Value | -32 | |||||||||
| Diluted Shares Outstanding, MM | 183 | |||||||||
| Equity Value Per Share | -0.18 |
What You Will Receive
- Authentic Pitney Bowes Data: Preloaded financial metrics – encompassing revenue to EBIT – derived from actual and projected statistics.
- Comprehensive Customization: Modify all key parameters (yellow cells) such as WACC, growth %, and tax rates as needed.
- Immediate Valuation Adjustments: Automatic recalculations to assess the impact of changes on Pitney Bowes Inc.'s fair value.
- Flexible Excel Template: Designed for quick edits, scenario analysis, and in-depth projections.
- Efficient and Precise: Avoid the hassle of constructing models from scratch while ensuring accuracy and adaptability.
Key Features
- Comprehensive DCF Model: Features detailed unlevered and levered Discounted Cash Flow valuation frameworks.
- WACC Analysis Tool: Ready-to-use Weighted Average Cost of Capital template with adjustable parameters.
- Customizable Forecast Inputs: Alter growth projections, capital spending, and discount rates as needed.
- Integrated Financial Ratios: Evaluate profitability, debt levels, and efficiency metrics for Pitney Bowes Inc. (PBI-PB).
- Interactive Dashboard and Visuals: Graphical representations highlight essential valuation metrics for straightforward interpretation.
How It Functions
- 1. Access the Template: Download and open the Excel file containing Pitney Bowes Inc.'s preloaded data.
- 2. Modify Assumptions: Adjust key inputs such as growth rates, WACC, and capital expenditures.
- 3. See Results Immediately: The DCF model automatically computes intrinsic value and NPV.
- 4. Explore Different Scenarios: Analyze various forecasts to evaluate different valuation results.
- 5. Utilize with Assurance: Present expert valuation insights to reinforce your decision-making.
Why Choose the Pitney Bowes Inc. NT 43 (PBI-PB) Calculator?
- Time-Saving: Skip the hassle of building a DCF model from scratch – it’s readily available for use.
- Enhanced Accuracy: Dependable financial data and formulas minimize valuation errors.
- Fully Customizable: Adjust the model to align with your specific assumptions and forecasts.
- User-Friendly: Intuitive charts and outputs ensure straightforward result analysis.
- Preferred by Professionals: Crafted for experts who prioritize both precision and usability.
Who Can Benefit from This Product?
- Finance Students: Master valuation techniques and put them into practice with real-world data.
- Academics: Utilize industry-standard models in your teaching or research endeavors.
- Investors: Challenge your own assumptions and evaluate valuation results for Pitney Bowes Inc. (PBI-PB).
- Analysts: Optimize your processes using a customizable, ready-to-use DCF model.
- Small Business Owners: Understand how large public companies like Pitney Bowes Inc. (PBI-PB) are assessed and analyzed.
Contents of the Template
- Pre-Filled Data: Contains historical financials and projections for Pitney Bowes Inc. (PBI-PB).
- Discounted Cash Flow Model: An editable DCF valuation model featuring automatic calculations.
- Weighted Average Cost of Capital (WACC): A specific worksheet for calculating WACC using your custom inputs.
- Key Financial Ratios: Evaluate Pitney Bowes’ profitability, efficiency, and leverage.
- Customizable Inputs: Effortlessly modify revenue growth, profit margins, and tax rates.
- Clear Dashboard: Visual representations through charts and tables summarizing critical valuation outcomes.
Disclaimer
All information, articles, and product details provided on this website are for general informational and educational purposes only. We do not claim any ownership over, nor do we intend to infringe upon, any trademarks, copyrights, logos, brand names, or other intellectual property mentioned or depicted on this site. Such intellectual property remains the property of its respective owners, and any references here are made solely for identification or informational purposes, without implying any affiliation, endorsement, or partnership.
We make no representations or warranties, express or implied, regarding the accuracy, completeness, or suitability of any content or products presented. Nothing on this website should be construed as legal, tax, investment, financial, medical, or other professional advice. In addition, no part of this site—including articles or product references—constitutes a solicitation, recommendation, endorsement, advertisement, or offer to buy or sell any securities, franchises, or other financial instruments, particularly in jurisdictions where such activity would be unlawful.
All content is of a general nature and may not address the specific circumstances of any individual or entity. It is not a substitute for professional advice or services. Any actions you take based on the information provided here are strictly at your own risk. You accept full responsibility for any decisions or outcomes arising from your use of this website and agree to release us from any liability in connection with your use of, or reliance upon, the content or products found herein.