
|
Valoración de DCF PCBL Limited (PCBL.NS) |
Completamente Editable: Adáptelo A Sus Necesidades En Excel O Sheets
Diseño Profesional: Plantillas Confiables Y Estándares De La Industria
Predeterminadas Para Un Uso Rápido Y Eficiente
Compatible con MAC / PC, completamente desbloqueado
No Se Necesita Experiencia; Fáciles De Seguir
PCBL Limited (PCBL.NS) Bundle
¿Busca determinar el valor intrínseco de PCBL Limited? Nuestra calculadora PCBLNS DCF integra datos del mundo real con extensas características de personalización, lo que le permite ajustar los pronósticos y mejorar sus opciones de inversión.
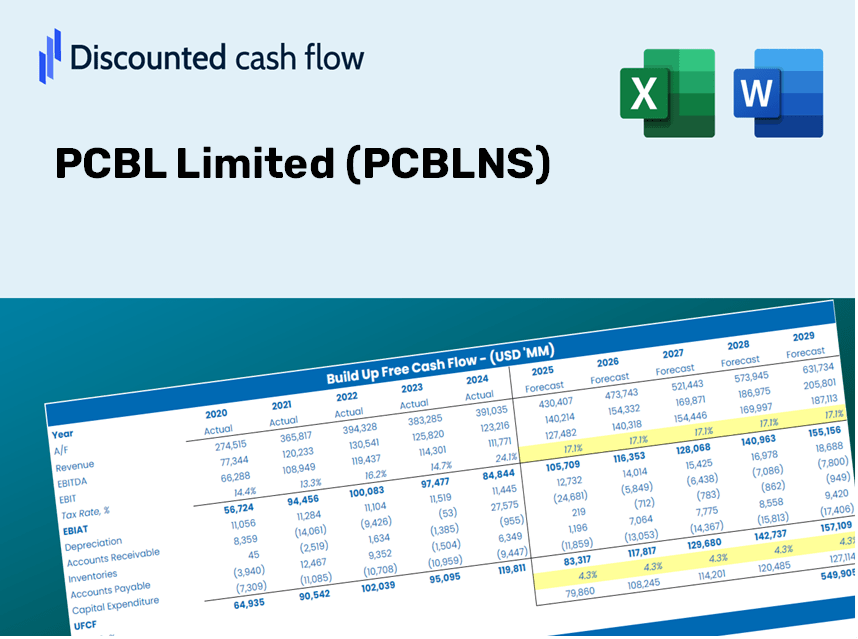
Discounted Cash Flow (DCF) - (USD MM)
| Year | AY1 2021 |
AY2 2022 |
AY3 2023 |
AY4 2024 |
AY5 2025 |
FY1 2026 |
FY2 2027 |
FY3 2028 |
FY4 2029 |
FY5 2030 |
|---|---|---|---|---|---|---|---|---|---|---|
| Revenue | 26,595.2 | 44,464.2 | 57,740.6 | 64,197.7 | 84,042.5 | 113,277.2 | 152,681.3 | 205,792.5 | 277,378.6 | 373,866.4 |
| Revenue Growth, % | 0 | 67.19 | 29.86 | 11.18 | 30.91 | 34.79 | 34.79 | 34.79 | 34.79 | 34.79 |
| EBITDA | 4,907.9 | 6,102.3 | 6,942.5 | 9,563.6 | 12,456.1 | 16,746.9 | 22,572.4 | 30,424.4 | 41,007.7 | 55,272.5 |
| EBITDA, % | 18.45 | 13.72 | 12.02 | 14.9 | 14.82 | 14.78 | 14.78 | 14.78 | 14.78 | 14.78 |
| Depreciation | 886.5 | 999.9 | 1,161.1 | 1,846.5 | 3,080.0 | 3,202.1 | 4,316.0 | 5,817.4 | 7,841.0 | 10,568.5 |
| Depreciation, % | 3.33 | 2.25 | 2.01 | 2.88 | 3.66 | 2.83 | 2.83 | 2.83 | 2.83 | 2.83 |
| EBIT | 4,021.4 | 5,102.4 | 5,781.4 | 7,717.1 | 9,376.1 | 13,544.8 | 18,256.4 | 24,607.0 | 33,166.7 | 44,704.0 |
| EBIT, % | 15.12 | 11.48 | 10.01 | 12.02 | 11.16 | 11.96 | 11.96 | 11.96 | 11.96 | 11.96 |
| Total Cash | 2,594.7 | 4,843.7 | 913.2 | 4,157.6 | 3,828.7 | 7,535.9 | 10,157.3 | 13,690.6 | 18,453.0 | 24,872.0 |
| Total Cash, percent | .0 | .0 | .0 | .0 | .0 | .0 | .0 | .0 | .0 | .0 |
| Account Receivables | 7,085.0 | 11,098.8 | 11,188.4 | 17,102.4 | 17,942.9 | 26,952.8 | 36,328.5 | 48,965.6 | 65,998.6 | 88,956.5 |
| Account Receivables, % | 26.64 | 24.96 | 19.38 | 26.64 | 21.35 | 23.79 | 23.79 | 23.79 | 23.79 | 23.79 |
| Inventories | 4,448.4 | 6,039.1 | 5,713.9 | 9,993.1 | 12,681.5 | 16,053.6 | 21,637.9 | 29,164.7 | 39,309.9 | 52,984.0 |
| Inventories, % | 16.73 | 13.58 | 9.9 | 15.57 | 15.09 | 14.17 | 14.17 | 14.17 | 14.17 | 14.17 |
| Accounts Payable | 5,916.3 | 9,111.2 | 9,564.0 | 18,020.2 | 15,947.2 | 24,093.1 | 32,474.0 | 43,770.2 | 58,996.0 | 79,518.1 |
| Accounts Payable, % | 22.25 | 20.49 | 16.56 | 28.07 | 18.98 | 21.27 | 21.27 | 21.27 | 21.27 | 21.27 |
| Capital Expenditure | -1,154.9 | -3,062.0 | -8,959.0 | -5,357.5 | -7,738.2 | -10,035.8 | -13,526.9 | -18,232.3 | -24,574.5 | -33,122.8 |
| Capital Expenditure, % | -4.34 | -6.89 | -15.52 | -8.35 | -9.21 | -8.86 | -8.86 | -8.86 | -8.86 | -8.86 |
| Tax Rate, % | 24.69 | 24.69 | 24.69 | 24.69 | 24.69 | 24.69 | 24.69 | 24.69 | 24.69 | 24.69 |
| EBITAT | 3,217.1 | 4,089.3 | 4,391.1 | 5,601.8 | 7,061.4 | 10,402.3 | 14,020.8 | 18,898.1 | 25,471.9 | 34,332.4 |
| Depreciation | ||||||||||
| Changes in Account Receivables | ||||||||||
| Changes in Inventories | ||||||||||
| Changes in Accounts Payable | ||||||||||
| Capital Expenditure | ||||||||||
| UFCF | -2,668.4 | -382.4 | -2,718.4 | 353.8 | -3,198.7 | -667.5 | -1,769.1 | -2,384.5 | -3,214.0 | -4,332.0 |
| WACC, % | 5.65 | 5.65 | 5.55 | 5.46 | 5.53 | 5.57 | 5.57 | 5.57 | 5.57 | 5.57 |
| PV UFCF | ||||||||||
| SUM PV UFCF | -10,138.0 | |||||||||
| Long Term Growth Rate, % | 2.00 | |||||||||
| Free cash flow (T + 1) | -4,419 | |||||||||
| Terminal Value | -123,834 | |||||||||
| Present Terminal Value | -94,444 | |||||||||
| Enterprise Value | -104,582 | |||||||||
| Net Debt | 51,822 | |||||||||
| Equity Value | -156,404 | |||||||||
| Diluted Shares Outstanding, MM | 378 | |||||||||
| Equity Value Per Share | -413.25 |
What You Will Receive
- Genuine PCBL Financial Data: Access to both historical and projected figures for precise valuation.
- Customizable Parameters: Adjust WACC, tax rates, revenue growth, and capital expenditures as needed.
- Instantaneous Calculations: Intrinsic value and NPV are computed automatically in real-time.
- Scenario Testing: Analyze multiple scenarios to assess PCBL's future performance.
- User-Friendly and Elegant Design: Crafted for professionals but easy for newcomers to navigate.
Core Features
- Authentic Financial Data for PCBL Limited: Gain access to reliable, pre-loaded historical figures and future forecasts.
- Tailorable Forecast Variables: Modify the yellow-highlighted fields, including WACC, growth rates, and profit margins.
- Real-Time Calculations: Experience automatic updates to DCF, Net Present Value (NPV), and cash flow assessments.
- Interactive Dashboard: User-friendly charts and summaries to help you visualize your valuation outcomes.
- Designed for All Skill Levels: An easy-to-navigate layout suitable for investors, CFOs, and consultants alike.
How It Works
- Download the Template: Gain immediate access to the Excel-based PCBL DCF Calculator.
- Input Your Assumptions: Customize the yellow-highlighted cells for growth rates, WACC, margins, and more.
- Instant Calculations: The model automatically refreshes PCBL Limited’s intrinsic value.
- Test Scenarios: Experiment with different assumptions to assess potential valuation shifts.
- Analyze and Decide: Utilize the results to inform your investment or financial strategies.
Why Opt for This Calculator?
- Precise Data: Current financials of PCBL Limited (PCBLNS) guarantee trustworthy valuation outcomes.
- Flexible: Modify essential parameters such as growth rates, WACC, and tax rates to align with your forecasts.
- Efficient: Built-in calculations save you the hassle of starting from the ground up.
- Professional Quality: Crafted for investors, analysts, and consultants alike.
- User-Friendly: An intuitive design and guided instructions ensure accessibility for all users.
Who Can Benefit from This Product?
- Professional Investors: Create comprehensive and trustworthy valuation models for insightful portfolio assessments.
- Corporate Finance Teams: Evaluate valuation scenarios to inform strategic decision-making.
- Consultants and Advisors: Deliver precise valuation insights for PCBL Limited (PCBLNS) to clients.
- Students and Educators: Leverage real-world data for practicing and teaching financial modeling techniques.
- Market Enthusiasts: Gain an understanding of how companies like PCBL Limited (PCBLNS) are valued in the financial landscape.
What the Template Includes
- Comprehensive DCF Model: A customizable template featuring detailed valuation computations.
- Real-World Data: PCBL Limited’s (PCBLNS) historical and forecasted financials included for in-depth analysis.
- Customizable Parameters: Modify WACC, growth rates, and tax assumptions to explore different scenarios.
- Financial Statements: Complete annual and quarterly reports for enhanced insights.
- Key Ratios: Integrated analysis covering profitability, efficiency, and leverage metrics.
- Dashboard with Visual Outputs: Visualizations and tables presenting clear, actionable results.
Disclaimer
All information, articles, and product details provided on this website are for general informational and educational purposes only. We do not claim any ownership over, nor do we intend to infringe upon, any trademarks, copyrights, logos, brand names, or other intellectual property mentioned or depicted on this site. Such intellectual property remains the property of its respective owners, and any references here are made solely for identification or informational purposes, without implying any affiliation, endorsement, or partnership.
We make no representations or warranties, express or implied, regarding the accuracy, completeness, or suitability of any content or products presented. Nothing on this website should be construed as legal, tax, investment, financial, medical, or other professional advice. In addition, no part of this site—including articles or product references—constitutes a solicitation, recommendation, endorsement, advertisement, or offer to buy or sell any securities, franchises, or other financial instruments, particularly in jurisdictions where such activity would be unlawful.
All content is of a general nature and may not address the specific circumstances of any individual or entity. It is not a substitute for professional advice or services. Any actions you take based on the information provided here are strictly at your own risk. You accept full responsibility for any decisions or outcomes arising from your use of this website and agree to release us from any liability in connection with your use of, or reliance upon, the content or products found herein.