
|
PDS LIMITED (PDSL.NS) DCF Valoración |
Completamente Editable: Adáptelo A Sus Necesidades En Excel O Sheets
Diseño Profesional: Plantillas Confiables Y Estándares De La Industria
Predeterminadas Para Un Uso Rápido Y Eficiente
Compatible con MAC / PC, completamente desbloqueado
No Se Necesita Experiencia; Fáciles De Seguir
PDS Limited (PDSL.NS) Bundle
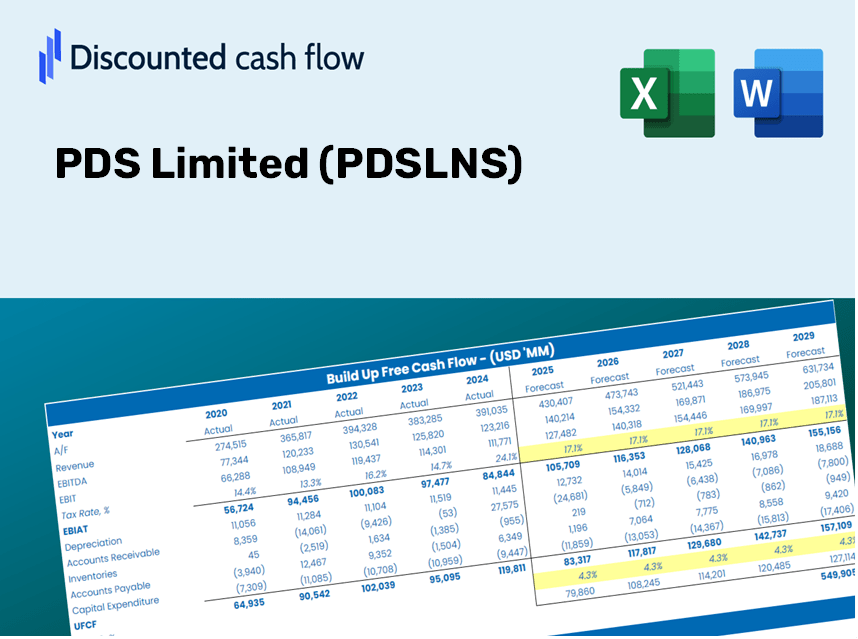
¡Explore el futuro financiero de PDS Limited (PDSLNS) con nuestra calculadora DCF fácil de usar! Ingrese sus suposiciones con respecto al crecimiento, los márgenes y los costos para calcular el valor intrínseco de PDS Limited (PDSLN) y refinar su estrategia de inversión.
Discounted Cash Flow (DCF) - (USD MM)
| Year | AY1 2019 |
AY2 2020 |
AY3 2021 |
AY4 2022 |
AY5 2023 |
FY1 2024 |
FY2 2025 |
FY3 2026 |
FY4 2027 |
FY5 2028 |
|---|---|---|---|---|---|---|---|---|---|---|
| Revenue | 66,480.4 | 62,128.7 | 88,282.1 | 105,770.0 | 103,726.5 | 106,800.2 | 109,965.0 | 113,223.6 | 116,578.7 | 120,033.3 |
| Revenue Growth, % | 0 | -6.55 | 42.1 | 19.81 | -1.93 | 2.96 | 2.96 | 2.96 | 2.96 | 2.96 |
| EBITDA | 2,197.4 | 2,794.3 | 4,192.0 | 5,255.8 | 4,476.8 | 4,664.3 | 4,802.5 | 4,944.8 | 5,091.3 | 5,242.2 |
| EBITDA, % | 3.31 | 4.5 | 4.75 | 4.97 | 4.32 | 4.37 | 4.37 | 4.37 | 4.37 | 4.37 |
| Depreciation | 480.0 | 651.4 | 692.5 | 801.8 | 934.3 | 900.0 | 926.7 | 954.2 | 982.5 | 1,011.6 |
| Depreciation, % | 0.72199 | 1.05 | 0.78445 | 0.75808 | 0.90071 | 0.84274 | 0.84274 | 0.84274 | 0.84274 | 0.84274 |
| EBIT | 1,717.4 | 2,142.9 | 3,499.5 | 4,454.0 | 3,542.5 | 3,764.2 | 3,875.8 | 3,990.6 | 4,108.9 | 4,230.6 |
| EBIT, % | 2.58 | 3.45 | 3.96 | 4.21 | 3.42 | 3.52 | 3.52 | 3.52 | 3.52 | 3.52 |
| Total Cash | 3,740.7 | 3,691.5 | 5,489.0 | 8,685.3 | 6,082.8 | 6,805.7 | 7,007.3 | 7,215.0 | 7,428.8 | 7,648.9 |
| Total Cash, percent | .0 | .0 | .0 | .0 | .0 | .0 | .0 | .0 | .0 | .0 |
| Account Receivables | 9,148.9 | 9,600.5 | 15,047.9 | 9,881.5 | 17,729.4 | 15,527.6 | 15,987.7 | 16,461.5 | 16,949.3 | 17,451.5 |
| Account Receivables, % | 13.76 | 15.45 | 17.05 | 9.34 | 17.09 | 14.54 | 14.54 | 14.54 | 14.54 | 14.54 |
| Inventories | 1,830.2 | 1,971.3 | 3,052.5 | 2,557.4 | 3,286.4 | 3,197.6 | 3,292.3 | 3,389.9 | 3,490.3 | 3,593.7 |
| Inventories, % | 2.75 | 3.17 | 3.46 | 2.42 | 3.17 | 2.99 | 2.99 | 2.99 | 2.99 | 2.99 |
| Accounts Payable | 7,289.2 | 8,924.5 | 15,663.2 | 11,248.5 | 15,041.9 | 14,569.1 | 15,000.9 | 15,445.4 | 15,903.1 | 16,374.3 |
| Accounts Payable, % | 10.96 | 14.36 | 17.74 | 10.63 | 14.5 | 13.64 | 13.64 | 13.64 | 13.64 | 13.64 |
| Capital Expenditure | -557.3 | -265.3 | -443.7 | -592.7 | -1,665.3 | -840.3 | -865.2 | -890.8 | -917.2 | -944.4 |
| Capital Expenditure, % | -0.83832 | -0.42702 | -0.50259 | -0.56039 | -1.61 | -0.78675 | -0.78675 | -0.78675 | -0.78675 | -0.78675 |
| Tax Rate, % | 37.94 | 37.94 | 37.94 | 37.94 | 37.94 | 37.94 | 37.94 | 37.94 | 37.94 | 37.94 |
| EBITAT | 873.0 | 1,063.2 | 2,803.5 | 3,308.2 | 2,198.6 | 2,385.7 | 2,456.4 | 2,529.2 | 2,604.2 | 2,681.3 |
| Depreciation | ||||||||||
| Changes in Account Receivables | ||||||||||
| Changes in Inventories | ||||||||||
| Changes in Accounts Payable | ||||||||||
| Capital Expenditure | ||||||||||
| UFCF | -2,894.3 | 2,491.9 | 3,262.4 | 4,764.1 | -3,315.8 | 4,263.4 | 2,394.8 | 2,465.8 | 2,538.9 | 2,614.1 |
| WACC, % | 5.27 | 5.25 | 5.86 | 5.74 | 5.5 | 5.52 | 5.52 | 5.52 | 5.52 | 5.52 |
| PV UFCF | ||||||||||
| SUM PV UFCF | 12,335.3 | |||||||||
| Long Term Growth Rate, % | 3.50 | |||||||||
| Free cash flow (T + 1) | 2,706 | |||||||||
| Terminal Value | 133,799 | |||||||||
| Present Terminal Value | 102,267 | |||||||||
| Enterprise Value | 114,602 | |||||||||
| Net Debt | 5,924 | |||||||||
| Equity Value | 108,678 | |||||||||
| Diluted Shares Outstanding, MM | 134 | |||||||||
| Equity Value Per Share | 811.75 |
What You'll Receive
- Accurate PDS Limited Financials: Access both historical data and future forecasts for precise valuation.
- Customizable Inputs: Adjust WACC, tax rates, revenue growth, and capital expenditures as needed.
- Real-Time Calculations: Dynamic calculations for intrinsic value and NPV at your fingertips.
- Scenario Simulation: Explore various scenarios to assess PDS Limited’s projected performance.
- User-Friendly Design: Designed for professionals, but easy to navigate for newcomers.
Key Features
- Comprehensive DCF Calculator: Offers both unlevered and levered DCF valuation models tailored for PDS Limited (PDSLNS).
- WACC Calculator: Features a pre-structured Weighted Average Cost of Capital sheet with adjustable parameters.
- Customizable Forecast Assumptions: Alter growth rates, capital expenditures, and discount rates as needed.
- Integrated Financial Ratios: Evaluate profitability, leverage, and efficiency ratios specifically for PDS Limited (PDSLNS).
- User-Friendly Dashboard and Charts: Visual representations provide a summary of essential valuation metrics for streamlined analysis.
How It Functions
- 1. Access the Template: Download and open the Excel file containing PDS Limited’s (PDSLNS) preloaded data.
- 2. Modify Assumptions: Adjust essential inputs such as growth rates, WACC, and capital expenditures.
- 3. Instant Results: The DCF model automatically updates to reflect intrinsic value and NPV calculations.
- 4. Experiment with Scenarios: Evaluate various forecasts to explore different valuation outcomes.
- 5. Utilize with Assurance: Present expert valuation insights to enhance your decision-making process.
Why Choose This Calculator for PDS Limited (PDSLNS)?
- User-Friendly Interface: Suitable for both novices and seasoned users.
- Customizable Inputs: Effortlessly adjust parameters to suit your financial analysis.
- Real-Time Feedback: Observe immediate changes in PDS Limited’s valuation as you modify inputs.
- Preconfigured Data: Features PDS Limited’s actual financial information for swift evaluations.
- Endorsed by Experts: Favored by investors and analysts for making strategic decisions.
Who Can Benefit from PDS Limited (PDSLNS)?
- Finance Students: Master valuation techniques and apply them with actual market data.
- Academics: Utilize professional models in your coursework or research projects.
- Investors: Validate your investment hypotheses and examine valuation results for PDS Limited (PDSLNS).
- Analysts: Enhance your efficiency with a customizable DCF model designed for your needs.
- Small Business Owners: Discover how major public companies like PDS Limited (PDSLNS) are evaluated in the market.
Components of the Template
- Pre-Filled Data: Contains PDS Limited's historical financial performance and projections.
- Discounted Cash Flow Model: An editable DCF valuation model with automated calculations.
- Weighted Average Cost of Capital (WACC): A specific sheet for calculating WACC using tailored inputs.
- Key Financial Ratios: Evaluate PDS Limited's profitability, operational efficiency, and financial leverage.
- Customizable Inputs: Easily adjust revenue growth rates, profit margins, and tax rates.
- Clear Dashboard: Visual representations with charts and tables summarizing essential valuation outcomes.
Disclaimer
All information, articles, and product details provided on this website are for general informational and educational purposes only. We do not claim any ownership over, nor do we intend to infringe upon, any trademarks, copyrights, logos, brand names, or other intellectual property mentioned or depicted on this site. Such intellectual property remains the property of its respective owners, and any references here are made solely for identification or informational purposes, without implying any affiliation, endorsement, or partnership.
We make no representations or warranties, express or implied, regarding the accuracy, completeness, or suitability of any content or products presented. Nothing on this website should be construed as legal, tax, investment, financial, medical, or other professional advice. In addition, no part of this site—including articles or product references—constitutes a solicitation, recommendation, endorsement, advertisement, or offer to buy or sell any securities, franchises, or other financial instruments, particularly in jurisdictions where such activity would be unlawful.
All content is of a general nature and may not address the specific circumstances of any individual or entity. It is not a substitute for professional advice or services. Any actions you take based on the information provided here are strictly at your own risk. You accept full responsibility for any decisions or outcomes arising from your use of this website and agree to release us from any liability in connection with your use of, or reliance upon, the content or products found herein.