
|
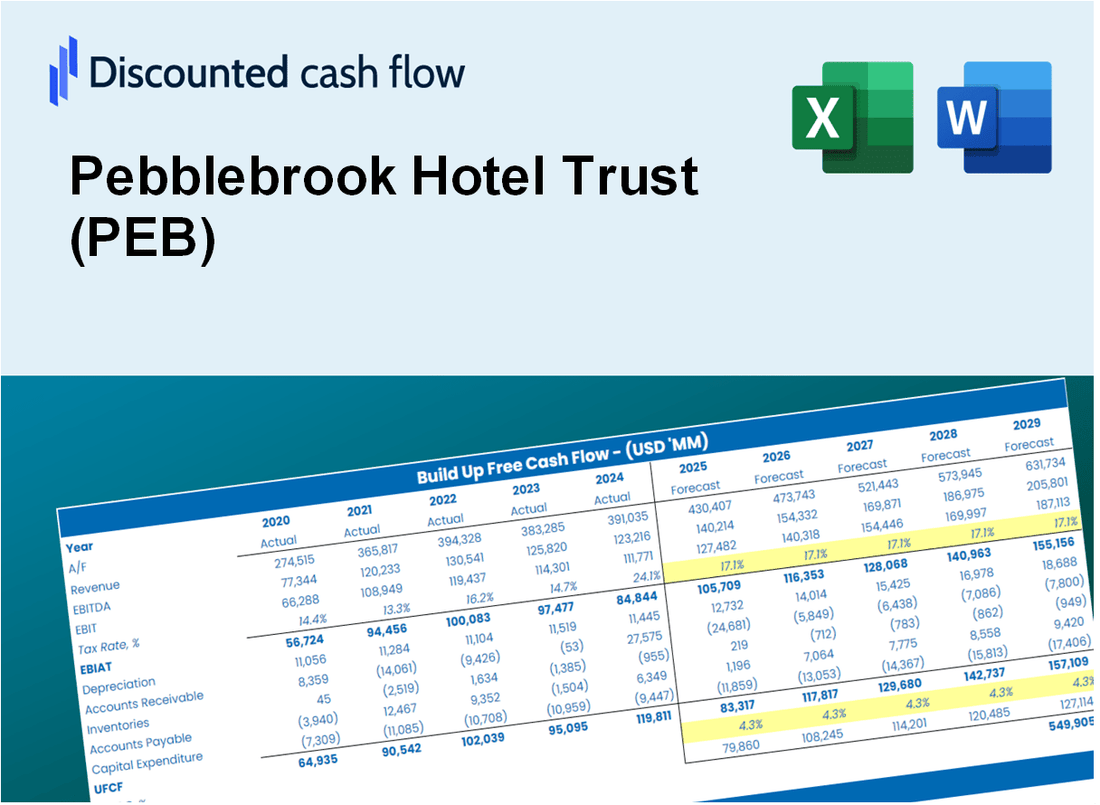
Valoración DCF de Pebblebrook Hotel Trust (PEB) |
Completamente Editable: Adáptelo A Sus Necesidades En Excel O Sheets
Diseño Profesional: Plantillas Confiables Y Estándares De La Industria
Predeterminadas Para Un Uso Rápido Y Eficiente
Compatible con MAC / PC, completamente desbloqueado
No Se Necesita Experiencia; Fáciles De Seguir
Pebblebrook Hotel Trust (PEB) Bundle
¡Mejore su estrategia de inversión con la calculadora DCF de Pebblebrook Hotel Trust (PEB)! Utilice datos financieros reales, ajuste las proyecciones y gastos de crecimiento, y observe instantáneamente cómo estas modificaciones afectan el valor intrínseco de Pebblebrook Hotel Trust (PEB).
Discounted Cash Flow (DCF) - (USD MM)
| Year | AY1 2020 |
AY2 2021 |
AY3 2022 |
AY4 2023 |
AY5 2024 |
FY1 2025 |
FY2 2026 |
FY3 2027 |
FY4 2028 |
FY5 2029 |
|---|---|---|---|---|---|---|---|---|---|---|
| Revenue | 442.9 | 733.0 | 1,391.9 | 1,419.9 | 1,453.3 | 2,033.8 | 2,846.0 | 3,982.7 | 5,573.4 | 7,799.4 |
| Revenue Growth, % | 0 | 65.51 | 89.88 | 2.02 | 2.35 | 39.94 | 39.94 | 39.94 | 39.94 | 39.94 |
| EBITDA | -74.9 | 124.8 | 238.4 | 274.6 | 306.4 | 234.5 | 328.2 | 459.3 | 642.7 | 899.4 |
| EBITDA, % | -16.92 | 17.03 | 17.13 | 19.34 | 21.08 | 11.53 | 11.53 | 11.53 | 11.53 | 11.53 |
| Depreciation | 224.6 | 224.3 | 239.6 | 240.6 | 229.5 | 533.9 | 747.1 | 1,045.5 | 1,463.0 | 2,047.3 |
| Depreciation, % | 50.7 | 30.59 | 17.21 | 16.95 | 15.79 | 26.25 | 26.25 | 26.25 | 26.25 | 26.25 |
| EBIT | -299.5 | -99.4 | -1.2 | 33.9 | 76.9 | -299.3 | -418.9 | -586.2 | -820.3 | -1,147.9 |
| EBIT, % | -67.62 | -13.56 | -0.0848486 | 2.39 | 5.29 | -14.72 | -14.72 | -14.72 | -14.72 | -14.72 |
| Total Cash | 124.3 | 58.5 | 41.0 | 183.7 | 206.7 | 269.1 | 376.5 | 526.9 | 737.4 | 1,031.9 |
| Total Cash, percent | .0 | .0 | .0 | .0 | .0 | .0 | .0 | .0 | .0 | .0 |
| Account Receivables | 10.2 | 37.0 | 45.3 | 43.9 | 39.1 | 66.7 | 93.3 | 130.6 | 182.8 | 255.8 |
| Account Receivables, % | 2.31 | 5.05 | 3.25 | 3.09 | 2.69 | 3.28 | 3.28 | 3.28 | 3.28 | 3.28 |
| Inventories | .0 | .0 | .0 | .0 | .0 | .0 | .0 | .0 | .0 | .0 |
| Inventories, % | 0 | 0 | 0 | 0 | 0 | 0 | 0 | 0 | 0 | 0 |
| Accounts Payable | 226.4 | 250.6 | 250.5 | 238.6 | 222.2 | 550.8 | 770.8 | 1,078.6 | 1,509.4 | 2,112.2 |
| Accounts Payable, % | 51.13 | 34.18 | 18 | 16.81 | 15.29 | 27.08 | 27.08 | 27.08 | 27.08 | 27.08 |
| Capital Expenditure | -125.0 | -83.8 | -116.7 | -200.6 | -128.8 | -288.9 | -404.4 | -565.9 | -791.9 | -1,108.1 |
| Capital Expenditure, % | -28.23 | -11.44 | -8.39 | -14.13 | -8.86 | -14.21 | -14.21 | -14.21 | -14.21 | -14.21 |
| Tax Rate, % | 83.44 | 83.44 | 83.44 | 83.44 | 83.44 | 83.44 | 83.44 | 83.44 | 83.44 | 83.44 |
| EBITAT | -296.0 | -98.6 | -1.2 | 36.0 | 12.7 | -248.2 | -347.4 | -486.1 | -680.2 | -951.9 |
| Depreciation | ||||||||||
| Changes in Account Receivables | ||||||||||
| Changes in Inventories | ||||||||||
| Changes in Accounts Payable | ||||||||||
| Capital Expenditure | ||||||||||
| UFCF | 19.7 | 39.1 | 113.3 | 65.4 | 101.9 | 297.7 | 188.7 | 264.1 | 369.5 | 517.1 |
| WACC, % | 6.36 | 6.37 | 6.39 | 6.39 | 4.2 | 5.94 | 5.94 | 5.94 | 5.94 | 5.94 |
| PV UFCF | ||||||||||
| SUM PV UFCF | 1,352.0 | |||||||||
| Long Term Growth Rate, % | 4.00 | |||||||||
| Free cash flow (T + 1) | 538 | |||||||||
| Terminal Value | 27,702 | |||||||||
| Present Terminal Value | 20,758 | |||||||||
| Enterprise Value | 22,110 | |||||||||
| Net Debt | 2,361 | |||||||||
| Equity Value | 19,749 | |||||||||
| Diluted Shares Outstanding, MM | 120 | |||||||||
| Equity Value Per Share | 164.88 |
What You Will Get
- Editable Forecast Inputs: Easily modify assumptions (growth %, margins, WACC) to explore various scenarios.
- Real-World Data: Pebblebrook Hotel Trust’s financial data pre-populated to kickstart your analysis.
- Automatic DCF Outputs: The template computes Net Present Value (NPV) and intrinsic value for you.
- Customizable and Professional: A refined Excel model that tailors to your valuation requirements.
- Built for Analysts and Investors: Perfect for evaluating projections, confirming strategies, and enhancing efficiency.
Key Features
- Comprehensive Financial Data: Gain access to reliable pre-loaded historical figures and future forecasts for Pebblebrook Hotel Trust (PEB).
- Adjustable Forecast Parameters: Modify highlighted fields such as WACC, growth rates, and profit margins to suit your analysis.
- Real-Time Calculations: Instant updates to DCF, Net Present Value (NPV), and cash flow assessments.
- User-Friendly Dashboard: Intuitive charts and summaries for a clear view of your valuation outcomes.
- Designed for All Levels: An accessible layout tailored for investors, CFOs, and consultants alike.
How It Works
- Download the Template: Gain immediate access to the Excel-based PEB DCF Calculator.
- Input Your Assumptions: Modify the yellow-highlighted cells for growth rates, WACC, margins, and other variables.
- Instant Calculations: The model automatically recalculates Pebblebrook Hotel Trust’s intrinsic value.
- Test Scenarios: Experiment with different assumptions to assess potential changes in valuation.
- Analyze and Decide: Leverage the results to inform your investment or financial analysis.
Why Choose This Calculator for Pebblebrook Hotel Trust (PEB)?
- Accuracy: Utilizes real Pebblebrook financials to ensure precise data.
- Flexibility: Allows users to easily test and adjust inputs to suit their needs.
- Time-Saving: Eliminate the complexity of constructing a DCF model from the ground up.
- Professional-Grade: Crafted with the expertise and usability expected at the CFO level.
- User-Friendly: Intuitive design makes it accessible for users without extensive financial modeling skills.
Who Should Use Pebblebrook Hotel Trust (PEB)?
- Real Estate Investors: Gain insights into hotel property valuations with a trusted investment vehicle.
- Financial Analysts: Utilize comprehensive data to enhance your property analysis and reporting.
- Consultants: Easily customize presentations and reports for clients in the hospitality sector.
- Hospitality Enthusiasts: Explore the dynamics of the hotel industry through real-time market performance.
- Educators and Students: Leverage as a case study for understanding real estate investment trusts (REITs) in academic settings.
What the Template Contains
- Comprehensive DCF Model: Editable template featuring thorough valuation calculations.
- Real-World Data: Pebblebrook Hotel Trust’s historical and projected financials preloaded for analysis.
- Customizable Parameters: Modify WACC, growth rates, and tax assumptions to explore various scenarios.
- Financial Statements: Complete annual and quarterly breakdowns for enhanced insights.
- Key Ratios: Integrated analysis for profitability, efficiency, and leverage metrics.
- Dashboard with Visual Outputs: Charts and tables for clear, actionable results.
Disclaimer
All information, articles, and product details provided on this website are for general informational and educational purposes only. We do not claim any ownership over, nor do we intend to infringe upon, any trademarks, copyrights, logos, brand names, or other intellectual property mentioned or depicted on this site. Such intellectual property remains the property of its respective owners, and any references here are made solely for identification or informational purposes, without implying any affiliation, endorsement, or partnership.
We make no representations or warranties, express or implied, regarding the accuracy, completeness, or suitability of any content or products presented. Nothing on this website should be construed as legal, tax, investment, financial, medical, or other professional advice. In addition, no part of this site—including articles or product references—constitutes a solicitation, recommendation, endorsement, advertisement, or offer to buy or sell any securities, franchises, or other financial instruments, particularly in jurisdictions where such activity would be unlawful.
All content is of a general nature and may not address the specific circumstances of any individual or entity. It is not a substitute for professional advice or services. Any actions you take based on the information provided here are strictly at your own risk. You accept full responsibility for any decisions or outcomes arising from your use of this website and agree to release us from any liability in connection with your use of, or reliance upon, the content or products found herein.