
|
Valoración DCF de TDH Holdings, Inc. (PETZ) |
Completamente Editable: Adáptelo A Sus Necesidades En Excel O Sheets
Diseño Profesional: Plantillas Confiables Y Estándares De La Industria
Predeterminadas Para Un Uso Rápido Y Eficiente
Compatible con MAC / PC, completamente desbloqueado
No Se Necesita Experiencia; Fáciles De Seguir
TDH Holdings, Inc. (PETZ) Bundle
¡Obtenga dominio sobre su análisis de valoración de TDH Holdings, Inc. (PETZ) con nuestra calculadora DCF de vanguardia! Equipado con datos reales (PETZ), esta plantilla de Excel le permite ajustar los pronósticos y supuestos para determinar con precisión el valor intrínseco de TDH Holdings, Inc.
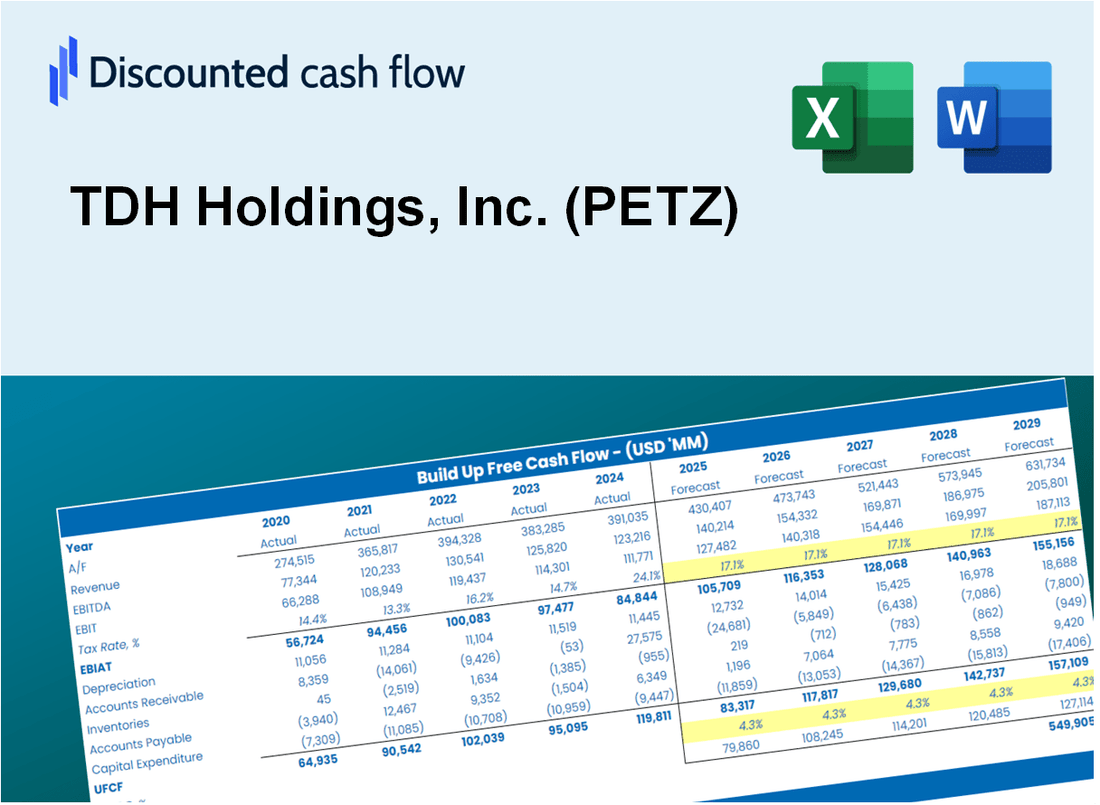
Discounted Cash Flow (DCF) - (USD MM)
| Year | AY1 2020 |
AY2 2021 |
AY3 2022 |
AY4 2023 |
AY5 2024 |
FY1 2025 |
FY2 2026 |
FY3 2027 |
FY4 2028 |
FY5 2029 |
|---|---|---|---|---|---|---|---|---|---|---|
| Revenue | .6 | 1.1 | 3.1 | 3.2 | .6 | .7 | .9 | 1.1 | 1.3 | 1.6 |
| Revenue Growth, % | 0 | 73.59 | 186.63 | 2.49 | -82.25 | 23.46 | 23.46 | 23.46 | 23.46 | 23.46 |
| EBITDA | .7 | -3.2 | -3.0 | -8.2 | 1.4 | -.1 | -.2 | -.2 | -.3 | -.3 |
| EBITDA, % | 117.25 | -291.45 | -97.34 | -259.05 | 253.6 | -19.47 | -19.47 | -19.47 | -19.47 | -19.47 |
| Depreciation | .4 | .9 | .0 | .3 | -.6 | .1 | .1 | .1 | .2 | .2 |
| Depreciation, % | 68.29 | 83.69 | 0.55229 | 9.21 | -100.18 | 12.35 | 12.35 | 12.35 | 12.35 | 12.35 |
| EBIT | .3 | -4.1 | -3.0 | -8.5 | 2.0 | -.2 | -.3 | -.3 | -.4 | -.5 |
| EBIT, % | 48.96 | -375.14 | -97.89 | -268.26 | 353.78 | -29.79 | -29.79 | -29.79 | -29.79 | -29.79 |
| Total Cash | 9.7 | 22.5 | 31.8 | 27.0 | 28.7 | .7 | .9 | 1.1 | 1.3 | 1.6 |
| Total Cash, percent | .0 | .0 | .0 | .0 | .0 | .0 | .0 | .0 | .0 | .0 |
| Account Receivables | .2 | .0 | .0 | .0 | .0 | .0 | .1 | .1 | .1 | .1 |
| Account Receivables, % | 27.06 | 3.41 | 0.94613 | 0.15621 | 1.02 | 6.52 | 6.52 | 6.52 | 6.52 | 6.52 |
| Inventories | .2 | .1 | .0 | .0 | .0 | .1 | .1 | .1 | .1 | .1 |
| Inventories, % | 39.7 | 4.76 | 0.03185173 | 0 | 0 | 8.9 | 8.9 | 8.9 | 8.9 | 8.9 |
| Accounts Payable | 3.3 | .5 | .5 | .5 | .1 | .3 | .3 | .4 | .5 | .6 |
| Accounts Payable, % | 535.4 | 46.89 | 15.91 | 14.51 | 21.69 | 39.8 | 39.8 | 39.8 | 39.8 | 39.8 |
| Capital Expenditure | .0 | 1.0 | .0 | .0 | -1.9 | -.2 | -.2 | -.2 | -.3 | -.3 |
| Capital Expenditure, % | -7.56 | 94.35 | -0.00016135627 | -0.24104 | -333.74 | -21.56 | -21.56 | -21.56 | -21.56 | -21.56 |
| Tax Rate, % | -39.42 | -39.42 | -39.42 | -39.42 | -39.42 | -39.42 | -39.42 | -39.42 | -39.42 | -39.42 |
| EBITAT | -.2 | -6.1 | -2.0 | -23.6 | 2.8 | -.2 | -.2 | -.2 | -.3 | -.4 |
| Depreciation | ||||||||||
| Changes in Account Receivables | ||||||||||
| Changes in Inventories | ||||||||||
| Changes in Accounts Payable | ||||||||||
| Capital Expenditure | ||||||||||
| UFCF | 3.1 | -6.7 | -2.0 | -23.3 | .0 | -.2 | -.2 | -.3 | -.3 | -.4 |
| WACC, % | 9.12 | 9.85 | 9.61 | 9.85 | 9.85 | 9.66 | 9.66 | 9.66 | 9.66 | 9.66 |
| PV UFCF | ||||||||||
| SUM PV UFCF | -1.1 | |||||||||
| Long Term Growth Rate, % | 2.00 | |||||||||
| Free cash flow (T + 1) | 0 | |||||||||
| Terminal Value | -6 | |||||||||
| Present Terminal Value | -4 | |||||||||
| Enterprise Value | -5 | |||||||||
| Net Debt | -13 | |||||||||
| Equity Value | 8 | |||||||||
| Diluted Shares Outstanding, MM | 10 | |||||||||
| Equity Value Per Share | 0.82 |
What You Will Receive
- Comprehensive Financial Model: TDH Holdings, Inc. (PETZ) data provides an accurate basis for DCF valuation.
- Complete Forecasting Control: Modify key metrics such as revenue growth, profit margins, WACC, and other essential drivers.
- Real-Time Calculations: Automatic updates let you view results immediately as you adjust inputs.
- Professional-Grade Template: A polished Excel file crafted for high-quality valuation presentations.
- Flexible and Reusable: Designed for adaptability, allowing for repeated application in detailed forecasting.
Key Features
- Customizable Financial Inputs: Adjust essential metrics such as revenue growth, net income margin, and capital investments.
- Instant DCF Valuation: Automatically computes intrinsic value, NPV, and other key financial indicators.
- High-Precision Analysis: Leverages TDH Holdings, Inc.'s (PETZ) actual financial data for accurate valuation results.
- Streamlined Scenario Testing: Effortlessly evaluate various assumptions and analyze different outcomes.
- Efficiency Booster: Avoid the hassle of constructing intricate valuation models from the ground up.
How It Works
- Download: Get the pre-built Excel file featuring TDH Holdings, Inc. (PETZ) financial data.
- Customize: Modify forecasts such as revenue growth, EBITDA %, and WACC to fit your analysis.
- Update Automatically: Watch as intrinsic value and NPV calculations refresh in real-time.
- Test Scenarios: Generate various projections and instantly compare their results.
- Make Decisions: Leverage the valuation findings to inform your investment choices.
Why Choose TDH Holdings, Inc. (PETZ)?
- Save Time: Skip the hassle of building financial models from the ground up – our tools are immediately available.
- Enhance Accuracy: Dependable financial insights and calculations minimize valuation inaccuracies.
- Completely Customizable: Adjust the model to align with your specific assumptions and forecasts.
- User-Friendly: Intuitive charts and results facilitate straightforward analysis.
- Endorsed by Professionals: Crafted for experts who prioritize both precision and functionality.
Who Should Use TDH Holdings, Inc. (PETZ)?
- Investors: Gain insights and make informed decisions with our comprehensive valuation resources.
- Financial Analysts: Streamline your analysis with our ready-to-use financial models tailored for customization.
- Consultants: Effortlessly modify our templates for impactful client presentations or detailed reports.
- Finance Enthusiasts: Enhance your knowledge of valuation strategies through practical, real-life applications.
- Educators and Students: Utilize our tools as effective learning aids in finance and investment courses.
What the Template Contains
- Pre-Filled Data: Includes TDH Holdings, Inc.'s (PETZ) historical financials and forecasts.
- Discounted Cash Flow Model: Editable DCF valuation model with automatic calculations.
- Weighted Average Cost of Capital (WACC): A dedicated sheet for calculating WACC based on custom inputs.
- Key Financial Ratios: Analyze TDH Holdings, Inc.'s (PETZ) profitability, efficiency, and leverage.
- Customizable Inputs: Edit revenue growth, margins, and tax rates with ease.
- Clear Dashboard: Charts and tables summarizing key valuation results.
Disclaimer
All information, articles, and product details provided on this website are for general informational and educational purposes only. We do not claim any ownership over, nor do we intend to infringe upon, any trademarks, copyrights, logos, brand names, or other intellectual property mentioned or depicted on this site. Such intellectual property remains the property of its respective owners, and any references here are made solely for identification or informational purposes, without implying any affiliation, endorsement, or partnership.
We make no representations or warranties, express or implied, regarding the accuracy, completeness, or suitability of any content or products presented. Nothing on this website should be construed as legal, tax, investment, financial, medical, or other professional advice. In addition, no part of this site—including articles or product references—constitutes a solicitation, recommendation, endorsement, advertisement, or offer to buy or sell any securities, franchises, or other financial instruments, particularly in jurisdictions where such activity would be unlawful.
All content is of a general nature and may not address the specific circumstances of any individual or entity. It is not a substitute for professional advice or services. Any actions you take based on the information provided here are strictly at your own risk. You accept full responsibility for any decisions or outcomes arising from your use of this website and agree to release us from any liability in connection with your use of, or reliance upon, the content or products found herein.