
|
Valoración de DCF Pfizer Limited (Pfizer.NS) |
Completamente Editable: Adáptelo A Sus Necesidades En Excel O Sheets
Diseño Profesional: Plantillas Confiables Y Estándares De La Industria
Predeterminadas Para Un Uso Rápido Y Eficiente
Compatible con MAC / PC, completamente desbloqueado
No Se Necesita Experiencia; Fáciles De Seguir
Pfizer Limited (PFIZER.NS) Bundle
¿Busca determinar el valor intrínseco de Pfizer Limited? Nuestra calculadora DCF (PFIZERN) integra datos del mundo real con características integrales de personalización, lo que le permite ajustar los pronósticos y mejorar sus estrategias de inversión.
What You'll Receive
- Authentic PFIZERNS Financial Data: Pre-loaded with Pfizer's historical and forecasted figures for detailed analysis.
- Completely Customizable Template: Effortlessly adjust key variables such as revenue growth, WACC, and EBITDA percentage.
- Instant Calculations: Witness the intrinsic value of Pfizer update in real-time as you make adjustments.
- Professional Valuation Tool: Tailored for investors, analysts, and consultants aiming for precise DCF outcomes.
- Intuitive Design: Streamlined layout and straightforward instructions suitable for all skill levels.
Key Features
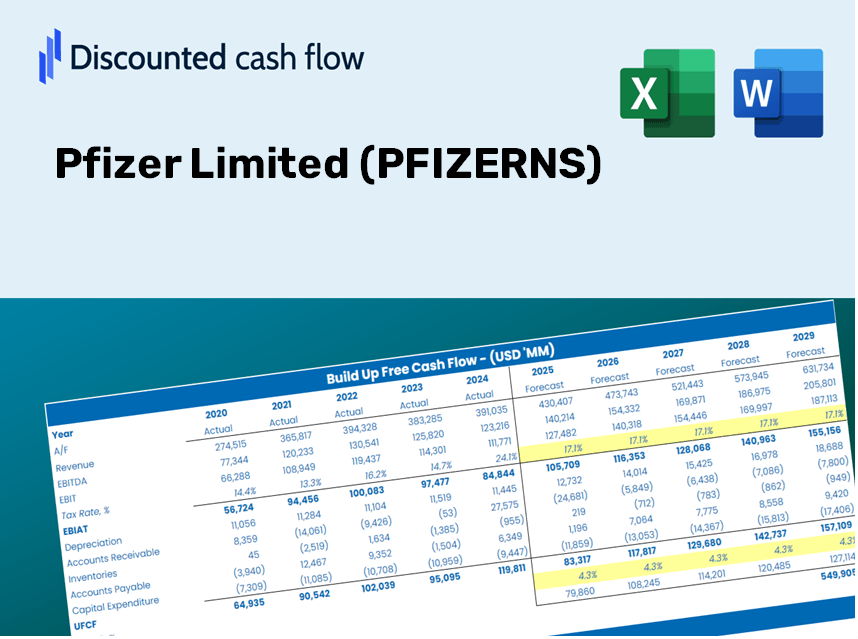
- Comprehensive DCF Calculator: Features detailed unlevered and levered DCF valuation models tailored for Pfizer Limited (PFIZERNS).
- WACC Calculator: Equipped with a pre-designed Weighted Average Cost of Capital sheet that allows for customizable inputs.
- Modifiable Forecast Assumptions: Adjust growth rates, capital expenditures, and discount rates as needed.
- Integrated Financial Ratios: Evaluate profitability, leverage, and efficiency ratios specifically for Pfizer Limited (PFIZERNS).
- Interactive Dashboard and Charts: Visual representations that condense key valuation metrics for straightforward analysis.
How It Operates
- Download the Template: Gain instant access to the Excel-based PFIZERNS DCF Calculator.
- Input Your Assumptions: Modify the yellow-highlighted cells for growth rates, WACC, margins, and additional parameters.
- Instant Calculations: The model automatically refreshes Pfizer's intrinsic value.
- Test Scenarios: Experiment with various assumptions to assess potential changes in valuation.
- Analyze and Decide: Utilize the insights to inform your investment or financial evaluation.
Why Choose This Calculator for Pfizer Limited (PFIZERNS)?
- All-in-One Solution: Integrates DCF, WACC, and financial ratio analyses for a thorough evaluation.
- Flexible Inputs: Modify the yellow-highlighted fields to explore different financial scenarios.
- In-Depth Analysis: Automatically computes Pfizer’s intrinsic value and Net Present Value.
- Preloaded Information: Includes historical and projected data for precise analysis.
- High-Quality Standards: Perfect for financial analysts, investors, and business consultants focusing on Pfizer Limited (PFIZERNS).
Who Can Benefit from This Product?
- Pharmaceutical Students: Master drug valuation techniques and apply them using real-world data.
- Researchers: Integrate industry-standard models into your studies or publications.
- Investors: Evaluate your own hypotheses and examine valuation results for Pfizer Limited (PFIZERNS) stock.
- Financial Analysts: Enhance your efficiency with a pre-designed, customizable DCF model tailored for pharmaceuticals.
- Healthcare Entrepreneurs: Discover how major public companies like Pfizer are assessed and valued.
Contents of the Template
- Comprehensive DCF Model: An editable template featuring detailed valuation calculations.
- Real-World Data: Pfizer Limited’s (PFIZERNS) historical and projected financials preloaded for in-depth analysis.
- Customizable Parameters: Easily modify WACC, growth rates, and tax assumptions to explore various scenarios.
- Financial Statements: Complete annual and quarterly breakdowns for enhanced insights.
- Key Ratios: Integrated analysis for assessing profitability, efficiency, and leverage.
- Dashboard with Visual Outputs: Visual representations such as charts and tables for clear, actionable results.
Disclaimer
All information, articles, and product details provided on this website are for general informational and educational purposes only. We do not claim any ownership over, nor do we intend to infringe upon, any trademarks, copyrights, logos, brand names, or other intellectual property mentioned or depicted on this site. Such intellectual property remains the property of its respective owners, and any references here are made solely for identification or informational purposes, without implying any affiliation, endorsement, or partnership.
We make no representations or warranties, express or implied, regarding the accuracy, completeness, or suitability of any content or products presented. Nothing on this website should be construed as legal, tax, investment, financial, medical, or other professional advice. In addition, no part of this site—including articles or product references—constitutes a solicitation, recommendation, endorsement, advertisement, or offer to buy or sell any securities, franchises, or other financial instruments, particularly in jurisdictions where such activity would be unlawful.
All content is of a general nature and may not address the specific circumstances of any individual or entity. It is not a substitute for professional advice or services. Any actions you take based on the information provided here are strictly at your own risk. You accept full responsibility for any decisions or outcomes arising from your use of this website and agree to release us from any liability in connection with your use of, or reliance upon, the content or products found herein.