
|
Supervisar & Gamble Health Limited (PGHL.NS) DCF Valoración |
Completamente Editable: Adáptelo A Sus Necesidades En Excel O Sheets
Diseño Profesional: Plantillas Confiables Y Estándares De La Industria
Predeterminadas Para Un Uso Rápido Y Eficiente
Compatible con MAC / PC, completamente desbloqueado
No Se Necesita Experiencia; Fáciles De Seguir
Procter & Gamble Health Limited (PGHL.NS) Bundle
Ingeniería para la precisión, nuestra calculadora DCF (PGHLNS) le permite evaluar la procuración & La valoración de Gamble Health Limited utilizando datos financieros del mundo real, que ofrece una flexibilidad completa para modificar todos los parámetros esenciales para proyecciones mejoradas.
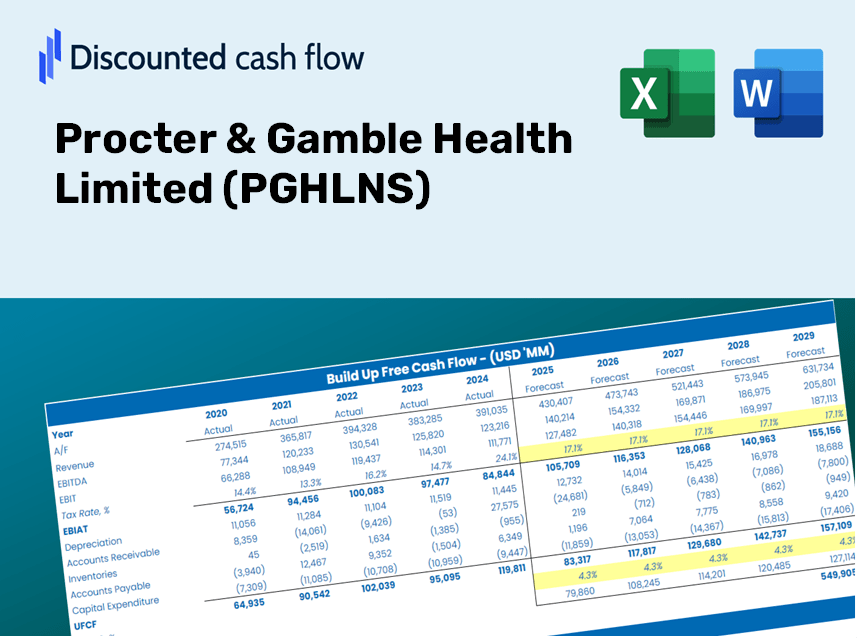
Discounted Cash Flow (DCF) - (USD MM)
| Year | AY1 2021 |
AY2 2022 |
AY3 2023 |
AY4 2024 |
AY5 2025 |
FY1 2026 |
FY2 2027 |
FY3 2028 |
FY4 2029 |
FY5 2030 |
|---|---|---|---|---|---|---|---|---|---|---|
| Revenue | 9,907.9 | 10,920.4 | 12,296.2 | 11,512.6 | 12,455.6 | 13,222.7 | 14,037.1 | 14,901.6 | 15,819.4 | 16,793.7 |
| Revenue Growth, % | 0 | 10.22 | 12.6 | -6.37 | 8.19 | 6.16 | 6.16 | 6.16 | 6.16 | 6.16 |
| EBITDA | 2,637.7 | 2,805.2 | 3,427.2 | 3,074.4 | 4,383.2 | 3,757.3 | 3,988.7 | 4,234.4 | 4,495.1 | 4,772.0 |
| EBITDA, % | 26.62 | 25.69 | 27.87 | 26.7 | 35.19 | 28.42 | 28.42 | 28.42 | 28.42 | 28.42 |
| Depreciation | 296.9 | 267.3 | 277.5 | 274.0 | 222.5 | 313.8 | 333.2 | 353.7 | 375.5 | 398.6 |
| Depreciation, % | 3 | 2.45 | 2.26 | 2.38 | 1.79 | 2.37 | 2.37 | 2.37 | 2.37 | 2.37 |
| EBIT | 2,340.8 | 2,537.9 | 3,149.7 | 2,800.4 | 4,160.7 | 3,443.4 | 3,655.5 | 3,880.7 | 4,119.7 | 4,373.4 |
| EBIT, % | 23.63 | 23.24 | 25.62 | 24.32 | 33.4 | 26.04 | 26.04 | 26.04 | 26.04 | 26.04 |
| Total Cash | 4,640.5 | 3,194.0 | 4,527.8 | 2,443.6 | 1,885.5 | 3,947.5 | 4,190.6 | 4,448.7 | 4,722.7 | 5,013.6 |
| Total Cash, percent | .0 | .0 | .0 | .0 | .0 | .0 | .0 | .0 | .0 | .0 |
| Account Receivables | 670.9 | 925.8 | 1,157.1 | 1,004.2 | 1,469.9 | 1,194.9 | 1,268.5 | 1,346.6 | 1,429.5 | 1,517.6 |
| Account Receivables, % | 6.77 | 8.48 | 9.41 | 8.72 | 11.8 | 9.04 | 9.04 | 9.04 | 9.04 | 9.04 |
| Inventories | 1,183.7 | 1,152.1 | 1,349.4 | 1,091.1 | 1,093.7 | 1,368.0 | 1,452.3 | 1,541.7 | 1,636.7 | 1,737.5 |
| Inventories, % | 11.95 | 10.55 | 10.97 | 9.48 | 8.78 | 10.35 | 10.35 | 10.35 | 10.35 | 10.35 |
| Accounts Payable | 1,330.1 | 1,720.8 | 2,370.4 | 1,670.0 | 1,716.0 | 2,029.5 | 2,154.5 | 2,287.2 | 2,428.0 | 2,577.6 |
| Accounts Payable, % | 13.42 | 15.76 | 19.28 | 14.51 | 13.78 | 15.35 | 15.35 | 15.35 | 15.35 | 15.35 |
| Capital Expenditure | -525.8 | -379.2 | -424.8 | -217.3 | -85.6 | -391.6 | -415.7 | -441.3 | -468.5 | -497.4 |
| Capital Expenditure, % | -5.31 | -3.47 | -3.45 | -1.89 | -0.68724 | -2.96 | -2.96 | -2.96 | -2.96 | -2.96 |
| Tax Rate, % | 24.78 | 24.78 | 24.78 | 24.78 | 24.78 | 24.78 | 24.78 | 24.78 | 24.78 | 24.78 |
| EBITAT | 1,774.1 | 1,928.4 | 2,300.3 | 2,059.2 | 3,129.8 | 2,572.7 | 2,731.1 | 2,899.3 | 3,077.9 | 3,267.5 |
| Depreciation | ||||||||||
| Changes in Account Receivables | ||||||||||
| Changes in Inventories | ||||||||||
| Changes in Accounts Payable | ||||||||||
| Capital Expenditure | ||||||||||
| UFCF | 1,020.7 | 1,983.9 | 2,374.0 | 1,826.7 | 2,844.4 | 2,809.1 | 2,615.7 | 2,776.8 | 2,947.8 | 3,129.4 |
| WACC, % | 5.6 | 5.6 | 5.6 | 5.6 | 5.6 | 5.6 | 5.6 | 5.6 | 5.6 | 5.6 |
| PV UFCF | ||||||||||
| SUM PV UFCF | 12,116.3 | |||||||||
| Long Term Growth Rate, % | 4.00 | |||||||||
| Free cash flow (T + 1) | 3,255 | |||||||||
| Terminal Value | 202,992 | |||||||||
| Present Terminal Value | 154,558 | |||||||||
| Enterprise Value | 166,674 | |||||||||
| Net Debt | -1,809 | |||||||||
| Equity Value | 168,483 | |||||||||
| Diluted Shares Outstanding, MM | 17 | |||||||||
| Equity Value Per Share | 10,150.30 |
What You'll Receive
- Genuine PGHLNS Financial Data: Access to historical and projected figures for precise valuation.
- Customizable Inputs: Adjust WACC, tax rates, revenue growth, and capital expenditures as needed.
- Automated Calculations: Intrinsic value and NPV are computed in real-time.
- Scenario Analysis: Explore various scenarios to assess Procter & Gamble Health Limited's future outlook.
- User-Friendly Interface: Designed for professionals while remaining accessible to newcomers.
Key Features
- Advanced DCF Calculator: Features comprehensive unlevered and levered DCF valuation models tailored for Procter & Gamble Health Limited (PGHLNS).
- WACC Calculator: Comes with a pre-built Weighted Average Cost of Capital sheet that allows for customizable inputs specific to PGHLNS.
- Editable Forecast Assumptions: Easily adjust growth rates, capital expenditures, and discount rates according to your projections for PGHLNS.
- Built-In Financial Ratios: Evaluate profitability, leverage, and efficiency ratios specifically for Procter & Gamble Health Limited (PGHLNS).
- Dashboard and Charts: Visual representations provide a summary of key valuation metrics, simplifying analysis for PGHLNS.
How It Works
- 1. Access the Template: Download and open the Excel file containing Procter & Gamble Health Limited’s (PGHLNS) pre-loaded data.
- 2. Modify Assumptions: Update crucial inputs such as growth rates, WACC, and capital expenditures as needed.
- 3. View Results Instantly: The DCF model will automatically calculate the intrinsic value and NPV for you.
- 4. Explore Scenarios: Analyze various forecasts to evaluate different valuation possibilities.
- 5. Present with Assurance: Share clear and professional valuation insights to enhance your decision-making process.
Why Choose This Calculator for Procter & Gamble Health Limited (PGHLNS)?
- User-Friendly Interface: Tailored for both novice users and seasoned professionals.
- Customizable Inputs: Effortlessly adjust parameters to suit your analytical needs.
- Real-Time Updates: Instantly view changes to Procter & Gamble's valuation as you tweak inputs.
- Preloaded Financial Data: Comes with Procter & Gamble's actual financial figures for immediate assessment.
- Widely Recognized: Valued by investors and analysts for making well-informed investment choices.
Who Can Benefit from This Product?
- Investors: Accurately assess Procter & Gamble Health Limited’s fair value before making investment choices.
- CFOs: Utilize a professional-grade DCF model for insightful financial reporting and analysis.
- Consultants: Easily customize the template for client valuation reports.
- Entrepreneurs: Acquire knowledge of financial modeling practices employed by top-tier companies.
- Educators: Implement it as a teaching resource to illustrate valuation methods.
What the Template Includes
- Pre-Filled Data: Contains Procter & Gamble Health Limited’s historical financial information and projections.
- Discounted Cash Flow Model: Customizable DCF valuation model featuring automated calculations.
- Weighted Average Cost of Capital (WACC): A separate sheet designed for calculating WACC based on user-defined inputs.
- Key Financial Ratios: Evaluate PGHLNS's profitability, efficiency, and financial leverage.
- Customizable Inputs: Easily modify revenue growth rates, profit margins, and tax assumptions.
- Clear Dashboard: Visual representations and tables summarizing crucial valuation outcomes.
Disclaimer
All information, articles, and product details provided on this website are for general informational and educational purposes only. We do not claim any ownership over, nor do we intend to infringe upon, any trademarks, copyrights, logos, brand names, or other intellectual property mentioned or depicted on this site. Such intellectual property remains the property of its respective owners, and any references here are made solely for identification or informational purposes, without implying any affiliation, endorsement, or partnership.
We make no representations or warranties, express or implied, regarding the accuracy, completeness, or suitability of any content or products presented. Nothing on this website should be construed as legal, tax, investment, financial, medical, or other professional advice. In addition, no part of this site—including articles or product references—constitutes a solicitation, recommendation, endorsement, advertisement, or offer to buy or sell any securities, franchises, or other financial instruments, particularly in jurisdictions where such activity would be unlawful.
All content is of a general nature and may not address the specific circumstances of any individual or entity. It is not a substitute for professional advice or services. Any actions you take based on the information provided here are strictly at your own risk. You accept full responsibility for any decisions or outcomes arising from your use of this website and agree to release us from any liability in connection with your use of, or reliance upon, the content or products found herein.