
|
Valoración de DCF Phoenix Mills Limited (Phoenixltd.ns) |
Completamente Editable: Adáptelo A Sus Necesidades En Excel O Sheets
Diseño Profesional: Plantillas Confiables Y Estándares De La Industria
Predeterminadas Para Un Uso Rápido Y Eficiente
Compatible con MAC / PC, completamente desbloqueado
No Se Necesita Experiencia; Fáciles De Seguir
The Phoenix Mills Limited (PHOENIXLTD.NS) Bundle
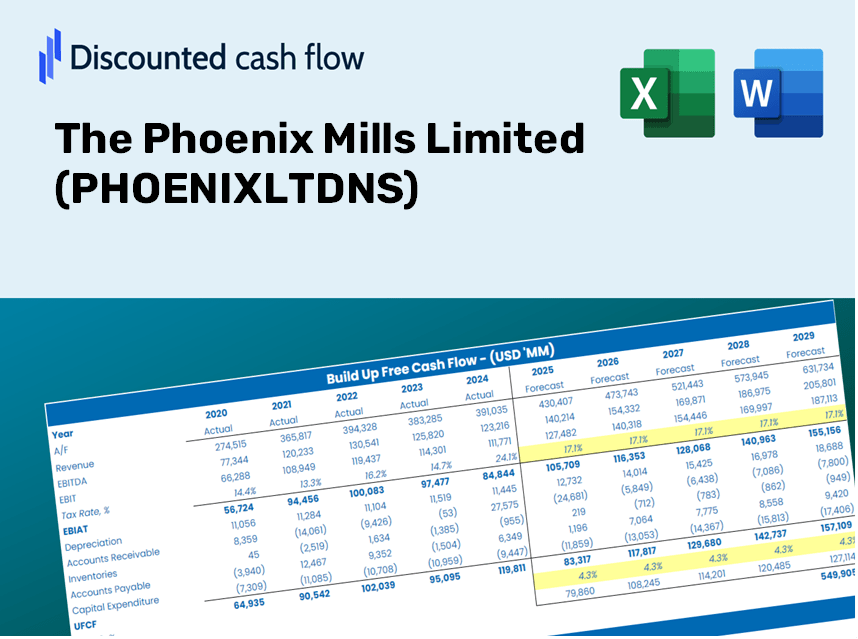
¡Evalúa las perspectivas financieras de Phoenix Mills Limited como un experto! Esta calculadora DCF (phoenixltdns) le proporciona información financiera precargada y flexibilidad completa para modificar el crecimiento de los ingresos, WACC, los márgenes y otros supuestos cruciales para alinearse con sus predicciones.
Benefits of Choosing The Phoenix Mills Limited (PHOENIXLTDNS)
- Flexible Forecast Inputs: Seamlessly modify key assumptions (growth %, margins, WACC) to explore various scenarios.
- Real-World Data: Financial data for The Phoenix Mills Limited is pre-filled to enhance your analysis.
- Automated DCF Calculations: The template computes Net Present Value (NPV) and intrinsic value automatically.
- Customizable and Polished: A sophisticated Excel model tailored to meet your valuation requirements.
- Designed for Analysts and Investors: Perfect for evaluating projections, confirming strategies, and optimizing time.
Key Features of The Phoenix Mills Limited (PHOENIXLTDNS)
- Customizable Growth Assumptions: Adjust essential parameters such as revenue expansion, EBITDA percentage, and capital investments.
- Instant DCF Valuation: Automatically computes intrinsic value, NPV, and additional metrics in real-time.
- High Precision Insights: Leverages The Phoenix Mills' actual financial data for accurate valuation assessments.
- Effortless Scenario Analysis: Explore various assumptions and easily juxtapose results.
- Efficiency Boost: Remove the hassle of constructing intricate valuation models from the ground up.
How It Works
- 1. Access the Template: Download and open the Excel file featuring The Phoenix Mills Limited’s preloaded data.
- 2. Modify Assumptions: Adjust critical inputs such as growth rates, WACC, and capital expenditures.
- 3. View Results in Real-Time: The DCF model automatically calculates intrinsic value and NPV.
- 4. Explore Scenarios: Analyze various forecasts to evaluate different valuation results.
- 5. Use with Assurance: Present expert valuation insights to bolster your decision-making.
Why Choose The Phoenix Mills Limited (PHOENIXLTDNS)?
- Time-Saving: Skip the hassle of building a financial model from the ground up – it's all set for you.
- Enhanced Accuracy: Dependable financial insights and calculations minimize valuation errors.
- Completely Customizable: Adjust the model to align with your specific assumptions and forecasts.
- User-Friendly: Intuitive charts and outputs simplify the analysis of results.
- Recommended by Professionals: Crafted for industry experts who prioritize precision and functionality.
Who Can Benefit from This Product?
- Professional Investors: Develop comprehensive and trustworthy valuation models for analyzing portfolios in relation to The Phoenix Mills Limited (PHOENIXLTDNS).
- Corporate Finance Teams: Evaluate valuation scenarios to inform strategic decisions within the organization.
- Consultants and Advisors: Deliver precise valuation insights to clients regarding The Phoenix Mills Limited (PHOENIXLTDNS).
- Students and Educators: Utilize real-world data for practical exercises and instruction in financial modeling.
- Real Estate Enthusiasts: Gain insight into the valuation of property management and development firms like The Phoenix Mills Limited (PHOENIXLTDNS).
Contents of the Template
- Comprehensive DCF Model: Editable template featuring detailed valuation calculations.
- Real-World Data: Historical and projected financial data for The Phoenix Mills Limited (PHOENIXLTDNS) preloaded for in-depth analysis.
- Customizable Parameters: Modify WACC, growth rates, and tax assumptions to explore various scenarios.
- Financial Statements: Complete annual and quarterly breakdowns for enhanced insights.
- Key Ratios: Integrated analysis covering profitability, efficiency, and leverage metrics.
- Dashboard with Visual Outputs: Visuals including charts and tables to present clear, actionable results.
Disclaimer
All information, articles, and product details provided on this website are for general informational and educational purposes only. We do not claim any ownership over, nor do we intend to infringe upon, any trademarks, copyrights, logos, brand names, or other intellectual property mentioned or depicted on this site. Such intellectual property remains the property of its respective owners, and any references here are made solely for identification or informational purposes, without implying any affiliation, endorsement, or partnership.
We make no representations or warranties, express or implied, regarding the accuracy, completeness, or suitability of any content or products presented. Nothing on this website should be construed as legal, tax, investment, financial, medical, or other professional advice. In addition, no part of this site—including articles or product references—constitutes a solicitation, recommendation, endorsement, advertisement, or offer to buy or sell any securities, franchises, or other financial instruments, particularly in jurisdictions where such activity would be unlawful.
All content is of a general nature and may not address the specific circumstances of any individual or entity. It is not a substitute for professional advice or services. Any actions you take based on the information provided here are strictly at your own risk. You accept full responsibility for any decisions or outcomes arising from your use of this website and agree to release us from any liability in connection with your use of, or reliance upon, the content or products found herein.