
|
Pidilite Industries Limited (Pidilitind.ns) Valoración de DCF |
Completamente Editable: Adáptelo A Sus Necesidades En Excel O Sheets
Diseño Profesional: Plantillas Confiables Y Estándares De La Industria
Predeterminadas Para Un Uso Rápido Y Eficiente
Compatible con MAC / PC, completamente desbloqueado
No Se Necesita Experiencia; Fáciles De Seguir
Pidilite Industries Limited (PIDILITIND.NS) Bundle
¡Mejore sus estrategias de inversión con la calculadora DCF (PidilitIndns)! Analice datos financieros genuinos de Pidilite Industries Limited, ajuste las proyecciones y gastos de crecimiento, y observe instantáneamente cómo estas modificaciones afectan el valor intrínseco de (PidilitIndns).
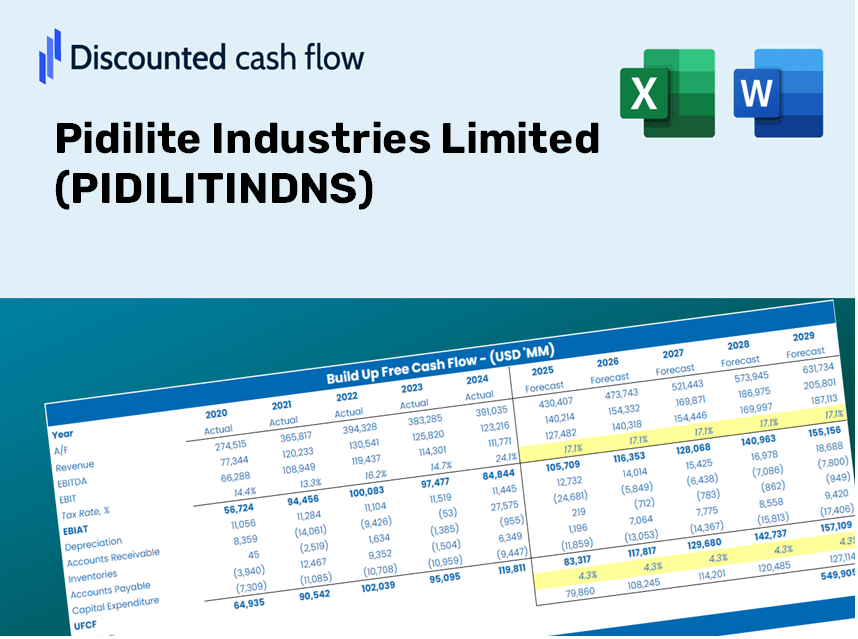
Discounted Cash Flow (DCF) - (USD MM)
| Year | AY1 2021 |
AY2 2022 |
AY3 2023 |
AY4 2024 |
AY5 2025 |
FY1 2026 |
FY2 2027 |
FY3 2028 |
FY4 2029 |
FY5 2030 |
|---|---|---|---|---|---|---|---|---|---|---|
| Revenue | 72,927.1 | 99,209.6 | 117,991.0 | 123,829.9 | 131,403.1 | 153,096.1 | 178,370.3 | 207,816.9 | 242,124.8 | 282,096.5 |
| Revenue Growth, % | 0 | 36.04 | 18.93 | 4.95 | 6.12 | 16.51 | 16.51 | 16.51 | 16.51 | 16.51 |
| EBITDA | 16,490.0 | 18,321.1 | 19,616.4 | 26,470.7 | 29,392.9 | 31,062.9 | 36,191.0 | 42,165.7 | 49,126.7 | 57,236.9 |
| EBITDA, % | 22.61 | 18.47 | 16.63 | 21.38 | 22.37 | 20.29 | 20.29 | 20.29 | 20.29 | 20.29 |
| Depreciation | 1,609.4 | 1,935.7 | 2,110.6 | 2,483.6 | 2,672.7 | 3,057.8 | 3,562.5 | 4,150.7 | 4,835.9 | 5,634.2 |
| Depreciation, % | 2.21 | 1.95 | 1.79 | 2.01 | 2.03 | 2 | 2 | 2 | 2 | 2 |
| EBIT | 14,880.6 | 16,385.4 | 17,505.8 | 23,987.1 | 26,720.2 | 28,005.2 | 32,628.5 | 38,015.0 | 44,290.8 | 51,602.7 |
| EBIT, % | 20.4 | 16.52 | 14.84 | 19.37 | 20.33 | 18.29 | 18.29 | 18.29 | 18.29 | 18.29 |
| Total Cash | 6,253.2 | 5,259.7 | 8,550.2 | 24,010.1 | 34,944.5 | 20,547.2 | 23,939.3 | 27,891.4 | 32,495.9 | 37,860.5 |
| Total Cash, percent | .0 | .0 | .0 | .0 | .0 | .0 | .0 | .0 | .0 | .0 |
| Account Receivables | 14,226.5 | 15,016.1 | 16,380.6 | 17,764.6 | 18,489.1 | 23,559.3 | 27,448.7 | 31,980.1 | 37,259.6 | 43,410.7 |
| Account Receivables, % | 19.51 | 15.14 | 13.88 | 14.35 | 14.07 | 15.39 | 15.39 | 15.39 | 15.39 | 15.39 |
| Inventories | 12,341.5 | 16,950.9 | 18,170.8 | 14,149.0 | 16,850.9 | 22,553.9 | 26,277.2 | 30,615.2 | 35,669.4 | 41,558.0 |
| Inventories, % | 16.92 | 17.09 | 15.4 | 11.43 | 12.82 | 14.73 | 14.73 | 14.73 | 14.73 | 14.73 |
| Accounts Payable | 10,067.4 | 10,492.9 | 10,635.9 | 11,476.0 | 13,900.5 | 16,302.1 | 18,993.4 | 22,129.0 | 25,782.2 | 30,038.5 |
| Accounts Payable, % | 13.8 | 10.58 | 9.01 | 9.27 | 10.58 | 10.65 | 10.65 | 10.65 | 10.65 | 10.65 |
| Capital Expenditure | -3,537.6 | -3,747.4 | -5,053.5 | -5,587.1 | -4,523.4 | -6,388.8 | -7,443.5 | -8,672.4 | -10,104.1 | -11,772.1 |
| Capital Expenditure, % | -4.85 | -3.78 | -4.28 | -4.51 | -3.44 | -4.17 | -4.17 | -4.17 | -4.17 | -4.17 |
| Tax Rate, % | 26.44 | 26.44 | 26.44 | 26.44 | 26.44 | 26.44 | 26.44 | 26.44 | 26.44 | 26.44 |
| EBITAT | 11,056.3 | 12,260.9 | 12,934.5 | 17,434.5 | 19,654.1 | 20,682.0 | 24,096.3 | 28,074.3 | 32,709.0 | 38,108.9 |
| Depreciation | ||||||||||
| Changes in Account Receivables | ||||||||||
| Changes in Inventories | ||||||||||
| Changes in Accounts Payable | ||||||||||
| Capital Expenditure | ||||||||||
| UFCF | -7,372.5 | 5,475.7 | 7,550.2 | 17,808.9 | 16,801.5 | 8,979.4 | 15,293.9 | 17,818.8 | 20,760.4 | 24,187.7 |
| WACC, % | 5.3 | 5.3 | 5.3 | 5.3 | 5.3 | 5.3 | 5.3 | 5.3 | 5.3 | 5.3 |
| PV UFCF | ||||||||||
| SUM PV UFCF | 73,147.3 | |||||||||
| Long Term Growth Rate, % | 4.00 | |||||||||
| Free cash flow (T + 1) | 25,155 | |||||||||
| Terminal Value | 1,932,646 | |||||||||
| Present Terminal Value | 1,492,718 | |||||||||
| Enterprise Value | 1,565,865 | |||||||||
| Net Debt | 1,302 | |||||||||
| Equity Value | 1,564,563 | |||||||||
| Diluted Shares Outstanding, MM | 1,020 | |||||||||
| Equity Value Per Share | 1,534.61 |
What You Will Receive
- Pre-Filled Financial Model: Utilize Pidilite Industries Limited’s actual data for accurate DCF valuation.
- Comprehensive Forecast Control: Modify revenue growth, profit margins, WACC, and other critical factors.
- Real-Time Calculations: Automatic updates allow you to see results instantly as you adjust inputs.
- Professional-Grade Template: An enhanced Excel file crafted for top-tier valuation purposes.
- Flexible and Reusable: Designed for adaptability, making it suitable for multiple detailed forecasts.
Key Features
- Pre-Loaded Data: Comprehensive historical financial statements and pre-filled forecasts for Pidilite Industries Limited (PIDILITINDNS).
- Fully Adjustable Inputs: Customize WACC, tax rates, revenue growth, and EBITDA margins to suit your analysis.
- Instant Results: Automatically update Pidilite’s intrinsic value in real time.
- Clear Visual Outputs: Intuitive dashboard charts present valuation results and essential metrics.
- Built for Accuracy: A reliable tool designed for analysts, investors, and financial professionals.
How It Works
- Step 1: Download the Excel file.
- Step 2: Review the pre-populated data for Pidilite Industries Limited (PIDILITINDNS), including historical and projected figures.
- Step 3: Modify key assumptions (highlighted in yellow) based on your assessment.
- Step 4: Observe automatic recalculations reflecting Pidilite's intrinsic value.
- Step 5: Utilize the results for investment analysis or reporting purposes.
Why Choose This Calculator?
- User-Friendly Interface: Crafted for both novices and seasoned users.
- Customizable Inputs: Adjust parameters easily to suit your analysis needs.
- Real-Time Feedback: Observe immediate updates to Pidilite Industries Limited's (PIDILITINDNS) valuation as you input data.
- Pre-Loaded Data: Comes equipped with Pidilite's actual financial figures for streamlined analysis.
- Relied Upon by Experts: Favored by investors and analysts for making well-informed choices.
Who Should Use This Product?
- Individual Investors: Make informed decisions regarding buying or selling Pidilite Industries Limited (PIDILITINDNS) stock.
- Financial Analysts: Enhance valuation processes with pre-built financial models tailored for Pidilite Industries Limited (PIDILITINDNS).
- Consultants: Provide clients with precise valuation insights for Pidilite Industries Limited (PIDILITINDNS) in a timely manner.
- Business Owners: Gain an understanding of how major companies like Pidilite Industries Limited (PIDILITINDNS) are valued to inform your strategic planning.
- Finance Students: Master valuation techniques using real-world data and case studies from Pidilite Industries Limited (PIDILITINDNS).
What the Template Contains
- Pre-Filled DCF Model: Pidilite Industries Limited’s (PIDILITINDNS) financial data preloaded for immediate use.
- WACC Calculator: Comprehensive calculations for Weighted Average Cost of Capital tailored for Pidilite Industries Limited.
- Financial Ratios: Assess Pidilite Industries Limited’s profitability, leverage, and operational efficiency.
- Editable Inputs: Modify assumptions such as growth rates, margins, and capital expenditures to suit your scenarios.
- Financial Statements: Access annual and quarterly reports for in-depth analysis of Pidilite Industries Limited.
- Interactive Dashboard: Effortlessly visualize key valuation metrics and outcomes for Pidilite Industries Limited.
Disclaimer
All information, articles, and product details provided on this website are for general informational and educational purposes only. We do not claim any ownership over, nor do we intend to infringe upon, any trademarks, copyrights, logos, brand names, or other intellectual property mentioned or depicted on this site. Such intellectual property remains the property of its respective owners, and any references here are made solely for identification or informational purposes, without implying any affiliation, endorsement, or partnership.
We make no representations or warranties, express or implied, regarding the accuracy, completeness, or suitability of any content or products presented. Nothing on this website should be construed as legal, tax, investment, financial, medical, or other professional advice. In addition, no part of this site—including articles or product references—constitutes a solicitation, recommendation, endorsement, advertisement, or offer to buy or sell any securities, franchises, or other financial instruments, particularly in jurisdictions where such activity would be unlawful.
All content is of a general nature and may not address the specific circumstances of any individual or entity. It is not a substitute for professional advice or services. Any actions you take based on the information provided here are strictly at your own risk. You accept full responsibility for any decisions or outcomes arising from your use of this website and agree to release us from any liability in connection with your use of, or reliance upon, the content or products found herein.