
|
Pantheon International Plc (PIN.L) Valoración de DCF |
Completamente Editable: Adáptelo A Sus Necesidades En Excel O Sheets
Diseño Profesional: Plantillas Confiables Y Estándares De La Industria
Predeterminadas Para Un Uso Rápido Y Eficiente
Compatible con MAC / PC, completamente desbloqueado
No Se Necesita Experiencia; Fáciles De Seguir
Pantheon International PLC (PIN.L) Bundle
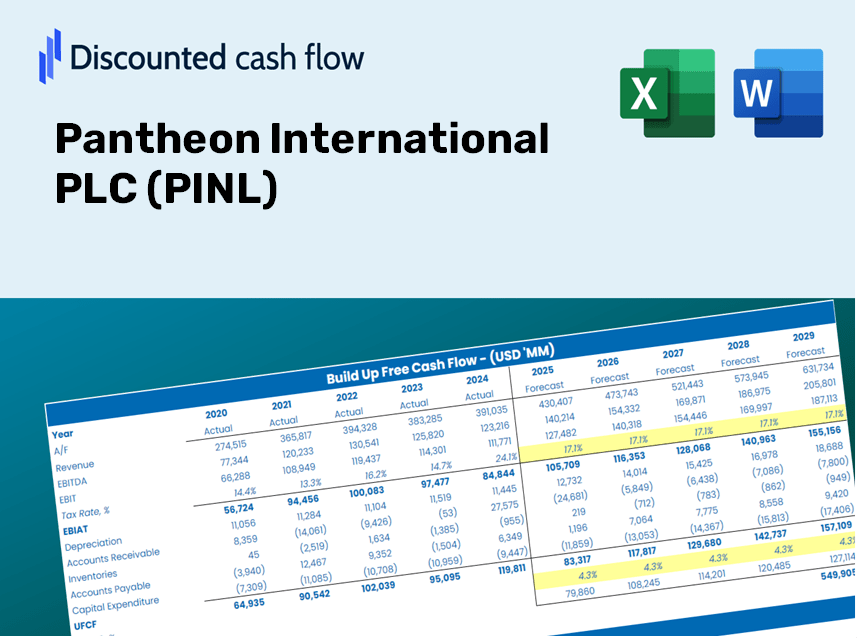
¡Obtenga dominio sobre su análisis de valoración Pantheon International PLC (PINL) con nuestra sofisticada calculadora DCF! Esta plantilla de Excel viene precargada con datos reales (PINL), lo que le permite ajustar los pronósticos y los supuestos para un cálculo preciso del valor intrínseco de Pantheon International PLC.
Discounted Cash Flow (DCF) - (USD MM)
| Year | AY1 2020 |
AY2 2021 |
AY3 2022 |
AY4 2023 |
AY5 2024 |
FY1 2025 |
FY2 2026 |
FY3 2027 |
FY4 2028 |
FY5 2029 |
|---|---|---|---|---|---|---|---|---|---|---|
| Revenue | 309.3 | 582.9 | 54.3 | 73.4 | 19.1 | 17.2 | 15.4 | 13.9 | 12.4 | 11.2 |
| Revenue Growth, % | 0 | 88.44 | -90.69 | 35.27 | -73.93 | -10.23 | -10.23 | -10.23 | -10.23 | -10.23 |
| EBITDA | -.7 | -.7 | -.5 | -.5 | -4.4 | -.9 | -.8 | -.7 | -.6 | -.6 |
| EBITDA, % | -0.22728 | -0.12558 | -0.89521 | -0.61685 | -23.13 | -5 | -5 | -5 | -5 | -5 |
| Depreciation | -324.4 | -560.1 | -41.0 | -42.2 | .0 | -11.3 | -10.2 | -9.1 | -8.2 | -7.3 |
| Depreciation, % | -104.87 | -96.09 | -75.45 | -57.52 | 0 | -65.81 | -65.81 | -65.81 | -65.81 | -65.81 |
| EBIT | 323.7 | 559.3 | 40.5 | 41.8 | -4.4 | 10.5 | 9.4 | 8.4 | 7.6 | 6.8 |
| EBIT, % | 104.64 | 95.96 | 74.56 | 56.9 | -23.13 | 60.86 | 60.86 | 60.86 | 60.86 | 60.86 |
| Total Cash | 199.1 | 231.5 | 66.0 | 21.9 | 25.4 | 11.5 | 10.3 | 9.2 | 8.3 | 7.5 |
| Total Cash, percent | .0 | .0 | .0 | .0 | .0 | .0 | .0 | .0 | .0 | .0 |
| Account Receivables | 5.7 | .6 | .3 | 1.1 | .4 | .2 | .2 | .2 | .2 | .1 |
| Account Receivables, % | 1.83 | 0.10208 | 0.56549 | 1.54 | 2.27 | 1.26 | 1.26 | 1.26 | 1.26 | 1.26 |
| Inventories | -2.6 | .0 | .0 | .0 | .0 | .0 | .0 | .0 | .0 | .0 |
| Inventories, % | -0.82731 | 0 | 0 | 0 | 0 | -0.16546 | -0.16546 | -0.16546 | -0.16546 | -0.16546 |
| Accounts Payable | 1.6 | 2.1 | 2.2 | 3.6 | 1.8 | .7 | .6 | .5 | .5 | .4 |
| Accounts Payable, % | 0.53215 | 0.36509 | 4.14 | 4.84 | 9.48 | 3.87 | 3.87 | 3.87 | 3.87 | 3.87 |
| Capital Expenditure | .0 | .0 | .0 | 27.5 | .0 | .0 | .0 | .0 | .0 | .0 |
| Capital Expenditure, % | 0 | 0 | 0 | 37.47 | 0 | 0 | 0 | 0 | 0 | 0 |
| Tax Rate, % | -51.58 | -51.58 | -51.58 | -51.58 | -51.58 | -51.58 | -51.58 | -51.58 | -51.58 | -51.58 |
| EBITAT | 327.5 | 556.4 | 39.1 | 38.1 | -6.7 | 10.2 | 9.2 | 8.2 | 7.4 | 6.6 |
| Depreciation | ||||||||||
| Changes in Account Receivables | ||||||||||
| Changes in Inventories | ||||||||||
| Changes in Accounts Payable | ||||||||||
| Capital Expenditure | ||||||||||
| UFCF | 1.6 | -.7 | -1.5 | 23.9 | -7.8 | -2.0 | -1.1 | -.9 | -.8 | -.8 |
| WACC, % | 6.27 | 6.27 | 6.24 | 6.2 | 6.27 | 6.25 | 6.25 | 6.25 | 6.25 | 6.25 |
| PV UFCF | ||||||||||
| SUM PV UFCF | -4.8 | |||||||||
| Long Term Growth Rate, % | 3.50 | |||||||||
| Free cash flow (T + 1) | -1 | |||||||||
| Terminal Value | -29 | |||||||||
| Present Terminal Value | -21 | |||||||||
| Enterprise Value | -26 | |||||||||
| Net Debt | 211 | |||||||||
| Equity Value | -237 | |||||||||
| Diluted Shares Outstanding, MM | 461 | |||||||||
| Equity Value Per Share | -51.44 |
What You Will Receive
- Authentic PINL Financial Data: Pre-populated with Pantheon International PLC's historical and projected figures for accurate analysis.
- Completely Customizable Template: Easily adjust key metrics such as revenue growth, WACC, and EBITDA percentage.
- Instant Calculations: Watch the intrinsic value of Pantheon International PLC update in real-time as you make changes.
- Expert Valuation Tool: Crafted for investors, analysts, and consultants aiming for precise DCF results.
- Intuitive Design: Straightforward layout and clear instructions suitable for all levels of expertise.
Key Features
- Pre-Loaded Data: Historical financial statements and pre-filled forecasts for Pantheon International PLC (PINL).
- Fully Customizable Inputs: Adjust variables such as WACC, tax rates, revenue growth, and EBITDA margins.
- Real-Time Results: Observe the intrinsic value of Pantheon International PLC (PINL) recalculating instantly.
- Clear Visual Outputs: Dashboard charts showcase valuation results and essential metrics.
- Designed for Precision: A professional-grade tool for analysts, investors, and finance professionals.
How It Operates
- Step 1: Download the prebuilt Excel template that includes data for Pantheon International PLC (PINL).
- Step 2: Navigate through the pre-filled sheets to familiarize yourself with the essential metrics.
- Step 3: Modify forecasts and assumptions in the editable yellow cells (WACC, growth, margins).
- Step 4: Instantly view the recalculated results, including Pantheon International PLC's intrinsic value.
- Step 5: Make informed investment choices or create reports based on the results.
Why Choose This Calculator for Pantheon International PLC (PINL)?
- Designed for Experts: A sophisticated tool utilized by analysts, CFOs, and financial consultants.
- Accurate Data: Historical and projected financials for Pantheon International loaded for precision.
- Forecast Simulations: Effortlessly test various scenarios and assumptions.
- Concise Results: Automatically determines intrinsic value, NPV, and essential metrics.
- User-Friendly: Step-by-step guidance ensures a smooth user experience.
Who Can Benefit from Pantheon International PLC (PINL)?
- Investors: Empower your investment choices with a sophisticated valuation tool designed for informed decision-making.
- Financial Analysts: Streamline your workflow with a customizable, pre-built DCF model at your fingertips.
- Consultants: Effortlessly modify the template for impactful client presentations or reports.
- Finance Enthusiasts: Enhance your grasp of valuation methods through practical, real-world illustrations.
- Educators and Students: Utilize it as a valuable resource for hands-on learning in finance courses.
Contents of the Template
- Preloaded PINL Data: Historical and projected financial metrics, encompassing revenue, EBIT, and capital expenditures.
- DCF and WACC Models: High-quality templates designed for calculating intrinsic value and the Weighted Average Cost of Capital.
- Editable Inputs: Cells highlighted in yellow for modifying revenue growth, tax rates, and discount rates.
- Financial Statements: Detailed annual and quarterly financial data for in-depth analysis.
- Key Ratios: Metrics for profitability, leverage, and efficiency to assess performance.
- Dashboard and Charts: Visual representations of valuation results and underlying assumptions.
Disclaimer
All information, articles, and product details provided on this website are for general informational and educational purposes only. We do not claim any ownership over, nor do we intend to infringe upon, any trademarks, copyrights, logos, brand names, or other intellectual property mentioned or depicted on this site. Such intellectual property remains the property of its respective owners, and any references here are made solely for identification or informational purposes, without implying any affiliation, endorsement, or partnership.
We make no representations or warranties, express or implied, regarding the accuracy, completeness, or suitability of any content or products presented. Nothing on this website should be construed as legal, tax, investment, financial, medical, or other professional advice. In addition, no part of this site—including articles or product references—constitutes a solicitation, recommendation, endorsement, advertisement, or offer to buy or sell any securities, franchises, or other financial instruments, particularly in jurisdictions where such activity would be unlawful.
All content is of a general nature and may not address the specific circumstances of any individual or entity. It is not a substitute for professional advice or services. Any actions you take based on the information provided here are strictly at your own risk. You accept full responsibility for any decisions or outcomes arising from your use of this website and agree to release us from any liability in connection with your use of, or reliance upon, the content or products found herein.