
|
Valuación DCF de Park Hotels & Resorts Inc. (PK) |
Completamente Editable: Adáptelo A Sus Necesidades En Excel O Sheets
Diseño Profesional: Plantillas Confiables Y Estándares De La Industria
Predeterminadas Para Un Uso Rápido Y Eficiente
Compatible con MAC / PC, completamente desbloqueado
No Se Necesita Experiencia; Fáciles De Seguir
Park Hotels & Resorts Inc. (PK) Bundle
Mejore sus estrategias de inversión con los hoteles del parque & Resorts Inc. (PK) ¡Calculadora DCF! Utilice datos financieros precisos, ajuste las proyecciones y gastos de crecimiento, y observe instantáneamente cómo estas alteraciones afectan el valor intrínseco de los hoteles del parque & Resorts Inc. (PK).
What You Will Get
- Editable Excel Template: A fully customizable Excel-based DCF Calculator featuring pre-filled real Park Hotels & Resorts Inc. (PK) financials.
- Real-World Data: Historical data and forward-looking estimates (as indicated in the highlighted cells).
- Forecast Flexibility: Adjust forecast assumptions such as revenue growth, EBITDA %, and WACC.
- Automatic Calculations: Instantly observe how your inputs affect Park Hotels & Resorts Inc. (PK)’s valuation.
- Professional Tool: Designed for investors, CFOs, consultants, and financial analysts.
- User-Friendly Design: Organized for clarity and ease of use, complete with step-by-step guidance.
Key Features
- Comprehensive Data: Park Hotels & Resorts Inc.'s historical financial statements and pre-filled projections.
- Customizable Inputs: Adjust WACC, tax rates, revenue growth, and EBITDA margins as needed.
- Real-Time Insights: View Park Hotels & Resorts Inc.'s intrinsic value recalculating instantly.
- Intuitive Visuals: Dashboard graphs illustrate valuation outcomes and essential metrics.
- Designed for Precision: A professional-grade tool for analysts, investors, and finance professionals.
How It Works
- Step 1: Download the Excel file for Park Hotels & Resorts Inc. (PK).
- Step 2: Review the pre-filled financial data and forecasts for Park Hotels & Resorts Inc. (PK).
- Step 3: Adjust key inputs such as occupancy rates, average daily rates, and operating expenses (highlighted cells).
- Step 4: Observe the DCF model update in real-time as you modify your assumptions.
- Step 5: Evaluate the outputs and leverage the results for your investment strategies.
Why Choose This Calculator for Park Hotels & Resorts Inc. (PK)?
- All-in-One Solution: Features DCF, WACC, and financial ratio analyses tailored for the hospitality sector.
- Flexible Inputs: Modify the highlighted cells to explore different investment scenarios.
- In-Depth Analysis: Automatically computes Park Hotels & Resorts Inc.'s intrinsic value and Net Present Value.
- Preloaded Information: Historical and projected data provide a solid foundation for analysis.
- Expert-Level Tool: Perfect for financial analysts, investors, and hospitality consultants.
Who Should Use This Product?
- Hospitality Students: Explore industry-specific financial models and apply them to real-world scenarios.
- Researchers: Utilize advanced valuation techniques in your studies related to the hospitality sector.
- Investors: Evaluate your investment strategies and assess the performance of Park Hotels & Resorts Inc. (PK).
- Financial Analysts: Enhance your analysis with a tailored, user-friendly DCF model for hotel valuations.
- Entrepreneurs: Understand the financial metrics and valuation methods used for major hotel chains like Park Hotels & Resorts Inc. (PK).
What the Template Contains
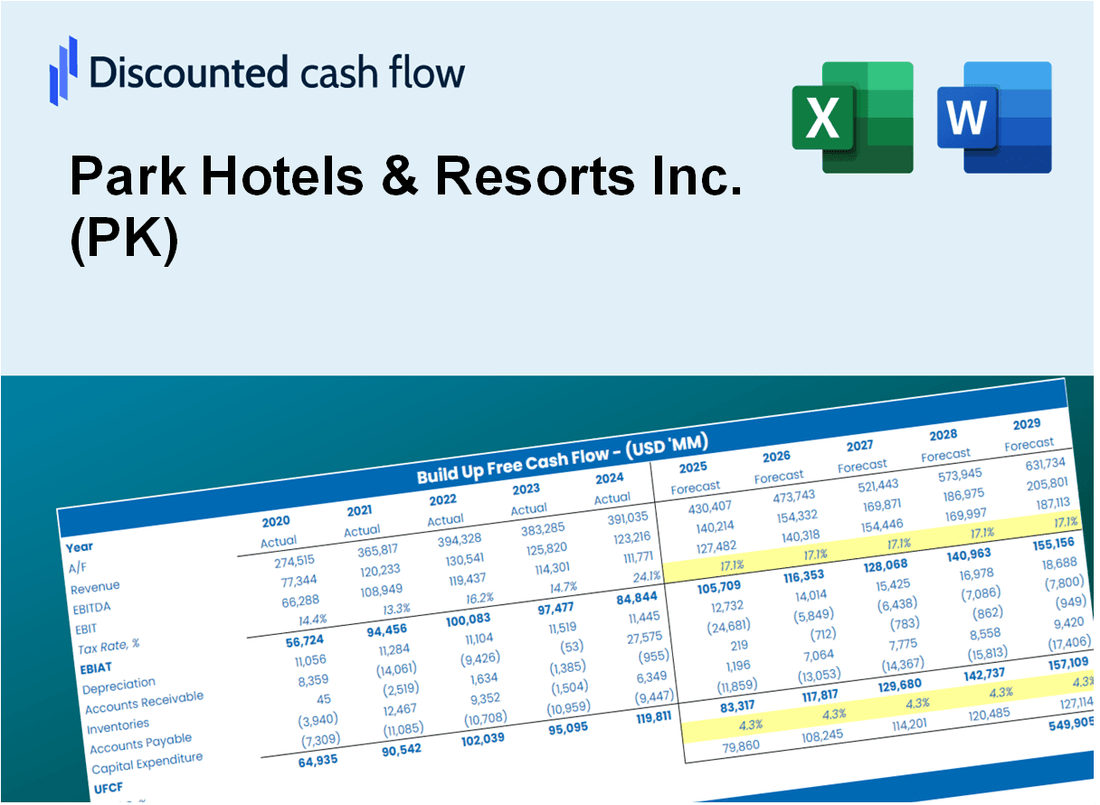
- Operating and Balance Sheet Data: Pre-filled Park Hotels & Resorts Inc. (PK) historical data and forecasts, including revenue, EBITDA, EBIT, and capital expenditures.
- WACC Calculation: A dedicated sheet for Weighted Average Cost of Capital (WACC), including parameters like Beta, risk-free rate, and share price.
- DCF Valuation (Unlevered and Levered): Editable Discounted Cash Flow models showing intrinsic value with detailed calculations.
- Financial Statements: Pre-loaded financial statements (annual and quarterly) to support analysis.
- Key Ratios: Includes profitability, leverage, and efficiency ratios for Park Hotels & Resorts Inc. (PK).
- Dashboard and Charts: Visual summary of valuation outputs and assumptions to analyze results easily.
Disclaimer
All information, articles, and product details provided on this website are for general informational and educational purposes only. We do not claim any ownership over, nor do we intend to infringe upon, any trademarks, copyrights, logos, brand names, or other intellectual property mentioned or depicted on this site. Such intellectual property remains the property of its respective owners, and any references here are made solely for identification or informational purposes, without implying any affiliation, endorsement, or partnership.
We make no representations or warranties, express or implied, regarding the accuracy, completeness, or suitability of any content or products presented. Nothing on this website should be construed as legal, tax, investment, financial, medical, or other professional advice. In addition, no part of this site—including articles or product references—constitutes a solicitation, recommendation, endorsement, advertisement, or offer to buy or sell any securities, franchises, or other financial instruments, particularly in jurisdictions where such activity would be unlawful.
All content is of a general nature and may not address the specific circumstances of any individual or entity. It is not a substitute for professional advice or services. Any actions you take based on the information provided here are strictly at your own risk. You accept full responsibility for any decisions or outcomes arising from your use of this website and agree to release us from any liability in connection with your use of, or reliance upon, the content or products found herein.