
|
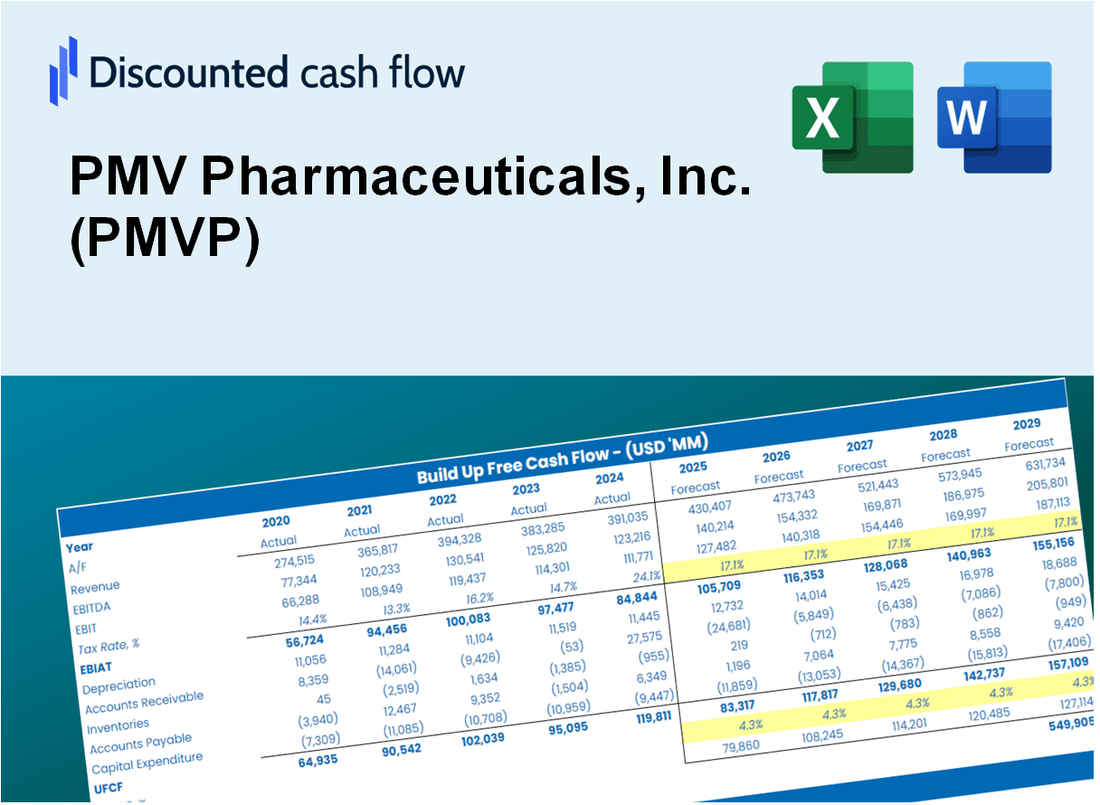
Valoración DCF de PMV Pharmaceuticals, Inc. (PMVP) |
Completamente Editable: Adáptelo A Sus Necesidades En Excel O Sheets
Diseño Profesional: Plantillas Confiables Y Estándares De La Industria
Predeterminadas Para Un Uso Rápido Y Eficiente
Compatible con MAC / PC, completamente desbloqueado
No Se Necesita Experiencia; Fáciles De Seguir
PMV Pharmaceuticals, Inc. (PMVP) Bundle
¡Explore el futuro financiero de PMV Pharmaceuticals, Inc. (PMVP) con nuestra calculadora DCF fácil de usar! Simplemente ingrese sus suposiciones para el crecimiento, los márgenes y los costos para calcular el valor intrínseco de PMV Pharmaceuticals, Inc. (PMVP) y mejorar su estrategia de inversión.
Discounted Cash Flow (DCF) - (USD MM)
| Year | AY1 2020 |
AY2 2021 |
AY3 2022 |
AY4 2023 |
AY5 2024 |
FY1 2025 |
FY2 2026 |
FY3 2027 |
FY4 2028 |
FY5 2029 |
|---|---|---|---|---|---|---|---|---|---|---|
| Revenue | .0 | .0 | .0 | .0 | .0 | .0 | .0 | .0 | .0 | .0 |
| Revenue Growth, % | 0 | 0 | 0 | 0 | 0 | 0 | 0 | 0 | 0 | 0 |
| EBITDA | -34.6 | -58.0 | -76.7 | -78.9 | -84.3 | .0 | .0 | .0 | .0 | .0 |
| EBITDA, % | 100 | 100 | 100 | 100 | 100 | 100 | 100 | 100 | 100 | 100 |
| Depreciation | .3 | 1.3 | .7 | 1.3 | 1.1 | .0 | .0 | .0 | .0 | .0 |
| Depreciation, % | 100 | 100 | 100 | 100 | 100 | 100 | 100 | 100 | 100 | 100 |
| EBIT | -34.9 | -59.3 | -77.4 | -80.1 | -85.4 | .0 | .0 | .0 | .0 | .0 |
| EBIT, % | 100 | 100 | 100 | 100 | 100 | 100 | 100 | 100 | 100 | 100 |
| Total Cash | 361.4 | 297.2 | 241.1 | 203.1 | 169.5 | .0 | .0 | .0 | .0 | .0 |
| Total Cash, percent | .0 | .0 | .0 | .0 | .0 | .0 | .0 | .0 | .0 | .0 |
| Account Receivables | .0 | .0 | .0 | .0 | .0 | .0 | .0 | .0 | .0 | .0 |
| Account Receivables, % | 100 | 100 | 100 | 100 | 100 | 100 | 100 | 100 | 100 | 100 |
| Inventories | .0 | .0 | .0 | .0 | .0 | .0 | .0 | .0 | .0 | .0 |
| Inventories, % | 100 | 100 | 100 | 100 | 100 | 100 | 100 | 100 | 100 | 100 |
| Accounts Payable | 1.6 | 3.2 | 3.0 | 3.2 | 6.6 | .0 | .0 | .0 | .0 | .0 |
| Accounts Payable, % | 100 | 100 | 100 | 100 | 100 | 100 | 100 | 100 | 100 | 100 |
| Capital Expenditure | -.1 | -1.3 | -8.0 | -1.0 | -.7 | .0 | .0 | .0 | .0 | .0 |
| Capital Expenditure, % | 100 | 100 | 100 | 100 | 100 | 0 | 0 | 0 | 0 | 0 |
| Tax Rate, % | 21.52 | 21.52 | 21.52 | 21.52 | 21.52 | 21.52 | 21.52 | 21.52 | 21.52 | 21.52 |
| EBITAT | -34.9 | -59.3 | -77.4 | -80.1 | -67.1 | .0 | .0 | .0 | .0 | .0 |
| Depreciation | ||||||||||
| Changes in Account Receivables | ||||||||||
| Changes in Inventories | ||||||||||
| Changes in Accounts Payable | ||||||||||
| Capital Expenditure | ||||||||||
| UFCF | -33.2 | -57.8 | -84.9 | -79.6 | -63.2 | -6.6 | .0 | .0 | .0 | .0 |
| WACC, % | 11.34 | 11.34 | 11.34 | 11.34 | 11.33 | 11.34 | 11.34 | 11.34 | 11.34 | 11.34 |
| PV UFCF | ||||||||||
| SUM PV UFCF | -5.9 | |||||||||
| Long Term Growth Rate, % | 2.00 | |||||||||
| Free cash flow (T + 1) | 0 | |||||||||
| Terminal Value | 0 | |||||||||
| Present Terminal Value | 0 | |||||||||
| Enterprise Value | -6 | |||||||||
| Net Debt | -40 | |||||||||
| Equity Value | 34 | |||||||||
| Diluted Shares Outstanding, MM | 52 | |||||||||
| Equity Value Per Share | 0.65 |
What You Will Get
- Real PMV Data: Preloaded financials – from revenue to EBIT – based on actual and projected figures for PMV Pharmaceuticals, Inc. (PMVP).
- Full Customization: Adjust all critical parameters (yellow cells) such as WACC, growth %, and tax rates to fit your analysis.
- Instant Valuation Updates: Automatic recalculations to assess the impact of changes on PMV Pharmaceuticals, Inc.'s (PMVP) fair value.
- Versatile Excel Template: Designed for quick edits, scenario testing, and comprehensive projections specific to PMV Pharmaceuticals, Inc. (PMVP).
- Time-Saving and Accurate: Eliminate the need to build models from the ground up while ensuring accuracy and adaptability.
Key Features
- Comprehensive Data: PMV Pharmaceuticals, Inc.'s historical financial statements and pre-filled projections.
- Customizable Inputs: Modify WACC, tax rates, revenue growth, and EBITDA margins as needed.
- Real-Time Results: Observe PMV Pharmaceuticals' intrinsic value recalculating instantly.
- Visual Dashboard: Charts that clearly present valuation results and essential metrics.
- Designed for Precision: A reliable tool for analysts, investors, and finance professionals.
How It Works
- 1. Access the Template: Download and open the Excel file featuring PMV Pharmaceuticals, Inc. (PMVP)'s preloaded data.
- 2. Modify Assumptions: Adjust key parameters such as growth rates, WACC, and capital expenditures.
- 3. Analyze Results Instantly: The DCF model automatically calculates intrinsic value and NPV.
- 4. Explore Scenarios: Evaluate various forecasts to assess different valuation possibilities.
- 5. Present with Assurance: Deliver professional valuation insights to back your strategic decisions.
Why Choose This Calculator for PMV Pharmaceuticals, Inc. (PMVP)?
- User-Friendly Interface: Tailored for both novice and seasoned users.
- Customizable Inputs: Adjust parameters easily to align with your financial analysis.
- Real-Time Adjustments: Watch PMV Pharmaceuticals' valuation update instantly as you change inputs.
- Pre-Loaded Data: Comes equipped with PMV Pharmaceuticals' latest financial metrics for swift evaluations.
- Relied Upon by Experts: Favored by investors and analysts for making strategic decisions.
Who Should Use This Product?
- Professional Investors: Develop comprehensive and accurate valuation models for analyzing PMV Pharmaceuticals, Inc. (PMVP).
- Corporate Finance Teams: Evaluate valuation scenarios to inform strategic decisions within the organization.
- Consultants and Advisors: Deliver precise valuation insights for clients interested in PMV Pharmaceuticals, Inc. (PMVP).
- Students and Educators: Leverage real-world data to enhance learning and practice in financial modeling.
- Biotech Enthusiasts: Gain insights into how biotech firms like PMV Pharmaceuticals, Inc. (PMVP) are valued in the investment landscape.
What the Template Contains
- Pre-Filled DCF Model: PMV Pharmaceuticals’ financial data preloaded for immediate use.
- WACC Calculator: Detailed calculations for Weighted Average Cost of Capital.
- Financial Ratios: Evaluate PMV Pharmaceuticals’ profitability, leverage, and efficiency.
- Editable Inputs: Change assumptions such as growth, margins, and CAPEX to fit your scenarios.
- Financial Statements: Annual and quarterly reports to support detailed analysis.
- Interactive Dashboard: Easily visualize key valuation metrics and results.
Disclaimer
All information, articles, and product details provided on this website are for general informational and educational purposes only. We do not claim any ownership over, nor do we intend to infringe upon, any trademarks, copyrights, logos, brand names, or other intellectual property mentioned or depicted on this site. Such intellectual property remains the property of its respective owners, and any references here are made solely for identification or informational purposes, without implying any affiliation, endorsement, or partnership.
We make no representations or warranties, express or implied, regarding the accuracy, completeness, or suitability of any content or products presented. Nothing on this website should be construed as legal, tax, investment, financial, medical, or other professional advice. In addition, no part of this site—including articles or product references—constitutes a solicitation, recommendation, endorsement, advertisement, or offer to buy or sell any securities, franchises, or other financial instruments, particularly in jurisdictions where such activity would be unlawful.
All content is of a general nature and may not address the specific circumstances of any individual or entity. It is not a substitute for professional advice or services. Any actions you take based on the information provided here are strictly at your own risk. You accept full responsibility for any decisions or outcomes arising from your use of this website and agree to release us from any liability in connection with your use of, or reliance upon, the content or products found herein.