
|
Análisis de 5 Fuerzas de PrimeEnergy Resources Corporation (PNRG): [Actualizado en Ene-2025] |
Completamente Editable: Adáptelo A Sus Necesidades En Excel O Sheets
Diseño Profesional: Plantillas Confiables Y Estándares De La Industria
Predeterminadas Para Un Uso Rápido Y Eficiente
Compatible con MAC / PC, completamente desbloqueado
No Se Necesita Experiencia; Fáciles De Seguir
PrimeEnergy Resources Corporation (PNRG) Bundle
En el panorama dinámico de la exploración energética, Primeenergy Resources Corporation navega por un ecosistema complejo de fuerzas competitivas que dan forma a su posicionamiento estratégico. A medida que los mercados globales evolucionan y las interrupciones tecnológicas desafían los paradigmas tradicionales de combustibles fósiles, comprender la intrincada interacción de la energía de los proveedores, la dinámica del cliente, la intensidad competitiva, las amenazas sustitutivas y los posibles nuevos participantes del mercado se vuelven cruciales para el crecimiento sostenible y la resiliencia estratégica. Este análisis de las cinco fuerzas de Porter proporciona una lente integral sobre los desafíos estratégicos y las oportunidades que enfrentan la Corporación de Recursos Primeenergy en 2024, revelando el entorno competitivo matizado que definirá su trayectoria futura.
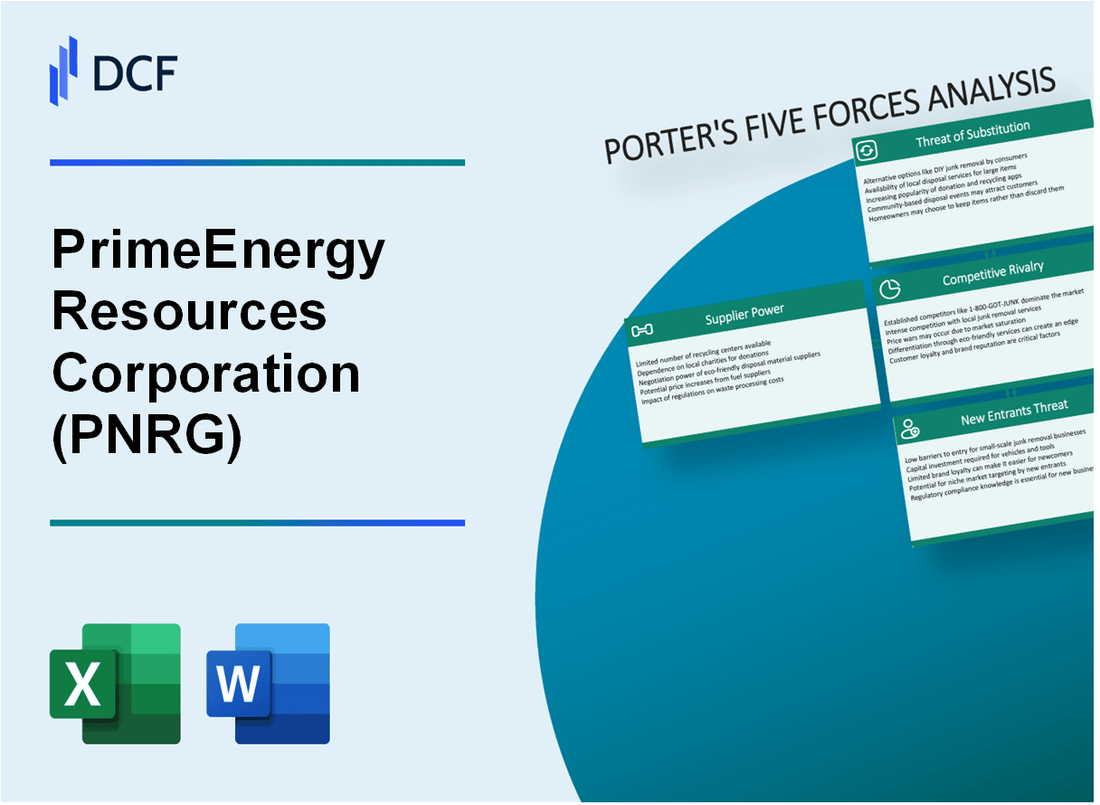
Primeenergy Resources Corporation (PNRG) - Las cinco fuerzas de Porter: poder de negociación de los proveedores
Propiedades de equipos especializados Paisaje
A partir de 2024, el mercado de equipos de petróleo y gas se caracteriza por una base de proveedores concentrada:
| Proveedores de equipos superiores | Cuota de mercado | Ingresos anuales |
|---|---|---|
| Schlumberger | 18.5% | $ 35.4 mil millones |
| Halliburton | 16.2% | $ 29.7 mil millones |
| Baker Hughes | 14.8% | $ 27.3 mil millones |
Requisitos de inversión de capital
Rangos de inversión de tecnología de campo petrolero especializado:
- Equipo de perforación: $ 2.1 millones a $ 7.5 millones por unidad
- Tecnología de extracción: $ 3.8 millones a $ 12.6 millones por sistema
- Tecnología de monitoreo del subsuelo: $ 1.2 millones a $ 4.9 millones
Métricas de interrupción de la cadena de suministro
| Impacto de tensión geopolítica | Porcentaje |
|---|---|
| Retrasos de entrega de equipos | 37% |
| Volatilidad de los precios | 42% |
| Interrupciones de la cadena de suministro | 28% |
Análisis de dependencia del proveedor
Métricas de concentración de proveedor clave:
- Los 3 principales proveedores controlan el 49.5% del mercado de equipos especializados
- Duración promedio del contrato del proveedor: 3-5 años
- Ciclo de reemplazo de equipos: 7-10 años
Primeenergy Resources Corporation (PNRG) - Las cinco fuerzas de Porter: poder de negociación de los clientes
Base de clientes concentrados en mercados de energía e industriales
Primeenergy Resources Corporation atiende a 127 principales clientes industriales a partir del cuarto trimestre de 2023, con los 10 principales clientes que representan el 62.4% de los ingresos totales.
| Segmento de clientes | Porcentaje de ingresos | Número de clientes |
|---|---|---|
| Fabricación | 34.2% | 47 |
| Petroquímico | 22.7% | 29 |
| Generación de energía | 18.5% | 22 |
| Transporte | 15.6% | 19 |
| Otras industrias | 9% | 10 |
Sensibilidad de precios impulsada por las fluctuaciones mundiales del mercado de petróleo y gas
La volatilidad del precio del petróleo crudo en 2023 varió de $ 68.44 a $ 93.69 por barril, impactando directamente las decisiones de compra de los clientes.
- Los precios spot de gas natural fluctuaron entre $ 2.12 y $ 4.87 por mmbtu
- Las variaciones de los precios de la mercancía energética influyen directamente en las estrategias de negociación del cliente
- La incertidumbre del mercado global aumenta la sensibilidad al precio del cliente en un 37%
Palancamiento de negociación de los grandes clientes industriales
Los 5 principales clientes industriales negocian contratos con descuentos de volumen promedio de 14.6% en comparación con los precios estándar.
| Tamaño del cliente | Consumo anual de energía | Rango de descuento de negociación |
|---|---|---|
| Grandes empresas | 500,000+ MWH | 12-18% |
| Empresas medianas | 100,000-499,999 MWh | 7-12% |
| Pequeñas empresas | Menos de 100,000 MWh | 3-7% |
Demanda de soluciones energéticas sostenibles
Los contratos de energía renovable aumentaron en un 24.3% en 2023, lo que representa $ 187.6 millones en nuevos acuerdos de energía sostenible.
- El cumplimiento del medio ambiente, social y de gobierno (ESG) impulsa el 41.2% de la toma de decisiones del cliente
- Los clientes que solicitan soluciones de energía neutral en carbono crecieron en un 33,7%
- Tasa de aceptación de primas de energía sostenible: 8.9%
Primeenergy Resources Corporation (PNRG) - Las cinco fuerzas de Porter: rivalidad competitiva
Intensa competencia en exploración y producción de petróleo y gas
A partir del cuarto trimestre de 2023, Primeenergy Resources Corporation opera en un mercado con 37 competidores directos en el sector de exploración de petróleo y gas. El mercado global de petróleo y gas aguas arriba se valoró en $ 1.87 billones en 2023.
| Competidor | Capitalización de mercado | Ingresos anuales |
|---|---|---|
| Exxonmobil | $ 446.99 mil millones | $ 413.7 mil millones |
| Cheurón | $ 304.14 mil millones | $ 239.8 mil millones |
| Conocophillips | $ 138.66 mil millones | $ 62.5 mil millones |
Corporaciones de energía multinacional con recursos sustanciales
Las principales corporaciones de energía demuestran capacidades financieras significativas:
- Gasto promedio de I + D: $ 1.2 mil millones anualmente
- Presupuesto promedio de exploración: $ 3.5 mil millones por año
- Gastos de capital anuales típicos: $ 8.7 mil millones
Tendencias de consolidación de la industria
Estadísticas de consolidación de la industria para 2023:
- Número de compañías de exploración independientes reducidas en un 22%
- Valor de fusión y adquisición: $ 78.3 mil millones
- Tamaño promedio de la transacción: $ 2.1 mil millones
Innovación tecnológica como diferenciador competitivo
Métricas de inversión tecnológica en 2023:
| Área tecnológica | Monto de la inversión | Tasa de adopción |
|---|---|---|
| AI y aprendizaje automático | $ 620 millones | 47% |
| Tecnologías de perforación avanzada | $ 1.3 mil millones | 62% |
| Transformación digital | $ 890 millones | 55% |
Primeenergy Resources Corporation (PNRG) - Las cinco fuerzas de Porter: amenaza de sustitutos
Alternativas de energía renovable desafiando los mercados tradicionales de combustibles fósiles
En 2023, la capacidad global de energía renovable alcanzó 3,372 GW, lo que representa un aumento del 9.6% de 2022. Las instalaciones solares fotovoltaicas representaron 413 GW de nueva capacidad, mientras que la energía eólica agregó 117 GW a nivel mundial.
| Tecnología de energía renovable | Capacidad global 2023 (GW) | Crecimiento año tras año |
|---|---|---|
| Solar fotovolta | 1,185 | 13.7% |
| Energía eólica | 837 | 8.5% |
| Tecnologías de hidrógeno | 42 | 22.3% |
Inversión en tecnologías de energía alternativa
La inversión global de energía limpia en 2023 alcanzó los $ 1.8 billones, con $ 495 mil millones dirigidos específicamente a la infraestructura de energía renovable.
- Inversiones de tecnología solar: $ 279 mil millones
- Inversiones de energía eólica: $ 166 mil millones
- Inversiones de tecnología de hidrógeno: $ 50 mil millones
Impacto en la política gubernamental
La Agencia de Energía Internacional informa que 130 países han implementado objetivos de emisiones netas cero, impactando directamente en la dinámica del mercado de combustibles fósiles.
| Tipo de política | Países implementando | Reducción de emisiones proyectadas |
|---|---|---|
| Mecanismos de fijación de precios de carbono | 68 | 12.5% para 2030 |
| Mandatos de energía renovable | 97 | 15.3% para 2030 |
Reducción potencial de la demanda a largo plazo para el petróleo y el gas tradicionales
Bloomberg New Energy Finance Projects Global Oil Demand to alcance en 103.5 millones de barriles por día en 2026, con una disminución proyectada del 2.5% anual a partir de entonces.
- Se espera que las ventas de vehículos eléctricos alcancen 17.5 millones de unidades en 2024
- Energía renovable proyectada que reemplaza el 22% de la generación de electricidad de combustibles fósiles para 2030
- Inversión acumulada estimada de $ 4.5 billones en transición de energía limpia para 2030
Primeenergy Resources Corporation (PNRG) - Las cinco fuerzas de Porter: amenaza de nuevos participantes
Altos requisitos de capital para la exploración y producción de petróleo y gas
Primeenergy Resources Corporation enfrenta barreras sustanciales de capital para los nuevos participantes del mercado. La exploración de petróleo y gas aguas arriba requiere aproximadamente $ 10 millones a $ 100 millones por proyecto de perforación. Los costos de la encuesta sísmica varían de $ 500,000 a $ 5 millones por bloque de exploración.
| Categoría de inversión de capital | Rango de costos estimado |
|---|---|
| Plataforma de perforación en alta mar | $ 500 millones - $ 1.2 mil millones |
| Plataforma de perforación en tierra | $ 20 millones - $ 50 millones |
| Equipo de exploración | $ 5 millones - $ 15 millones |
Entorno regulatorio estricto y procesos de permisos complejos
El cumplimiento regulatorio implica inversiones financieras y administrativas sustanciales. Los costos de adquisición de permisos promedian de $ 250,000 a $ 750,000 por proyecto. Las evaluaciones de impacto ambiental oscilan entre $ 100,000 y $ 500,000.
- Tiempo de procesamiento del permiso de perforación federal: 60-120 días
- Gastos legales promedio de cumplimiento ambiental: $ 300,000 anualmente
- Costos de preparación de documentación regulatoria: $ 75,000 - $ 250,000
Capacidades tecnológicas avanzadas para una extracción eficiente
Las tecnologías de extracción avanzadas requieren importantes inversiones tecnológicas. Los costos de desarrollo de tecnología de fractura hidráulica varían de $ 5 millones a $ 25 millones. Las inversiones de tecnología de imágenes sísmicas promedian $ 3 millones a $ 10 millones.
| Categoría de tecnología | Rango de inversión |
|---|---|
| Tecnologías de perforación avanzada | $ 7 millones - $ 30 millones |
| Sistemas de exploración de inteligencia artificial | $ 2 millones - $ 15 millones |
Cumplimiento ambiental y barreras de sostenibilidad
Los requisitos de sostenibilidad ambiental imponen barreras de entrada significativas. Los sistemas de monitoreo de emisiones de carbono cuestan entre $ 500,000 y $ 2 millones. Las inversiones de integración de energía renovable varían de $ 10 millones a $ 50 millones.
- Presupuesto anual de cumplimiento ambiental: $ 1.5 millones - $ 5 millones
- Inversiones de tecnología de reducción de gases de efecto invernadero: $ 3 millones - $ 20 millones
- Costos del proyecto de restauración ecológica: $ 500,000 - $ 3 millones por proyecto
PrimeEnergy Resources Corporation (PNRG) - Porter's Five Forces: Competitive rivalry
Rivalry is high among independent E&P companies like Vitesse Energy and HighPeak Energy. The competitive intensity is visible when comparing balance sheets and recent profitability metrics across the peer group.
The industry is mature with high exit barriers due to fixed assets like wells and infrastructure. Still, PrimeEnergy Resources Corporation maintains a distinct advantage through its capital structure.
PNRG's strong financial health with zero outstanding bank debt gives it a competitive edge. As of September 30, 2025, PrimeEnergy Resources Corporation had zero outstanding bank debt and full availability under its $115 million revolving credit facility. This contrasts with peers; for instance, Vitesse Energy reported total debt of $106.0 million as of June 30, 2025.
The company was ranked #1 in Forbes' Oil & Gas Operations small-cap list in 2025, indicating strong relative performance. This ranking reflects success in growth, profitability, and return on investment metrics for companies under $2 billion in market capitalization.
Sustained profitability is key; PrimeEnergy Resources Corporation reported $22.9 million year-to-date net income through Q3 2025. This was built on a Q3 2025 net income of $10.6 million and operating cash flow of $84.5 million for the first nine months of 2025.
Here's a quick look at how PrimeEnergy Resources Corporation stacks up against a comparable entity in the E&P space based on recent reported figures:
| Metric | PrimeEnergy Resources Corporation (as of 9/30/2025 YTD) | Vitesse Energy (as of 6/30/2025) |
| Year-to-Date/Quarter Net Income | $22.9 million (YTD) / $10.6 million (Q3) | $24.7 million (Q2 Net Income) |
| Operating Cash Flow | $84.5 million (9 Months) | $66.0 million (Q2 Cash flow from operations) |
| Total Debt | $0 (Bank Debt) | $106.0 million |
| Credit Facility Availability | $115 million | $144.0 million (Revolving credit facility availability as of 6/30/2025) |
The competitive environment forces capital discipline. For example, Vitesse Energy hedged approximately 71% of its remaining 2025 oil production at a weighted average price of $69.83 per barrel based on the midpoint of its guidance.
PrimeEnergy Resources Corporation also actively manages its share count, retiring 73,470 shares year-to-date, which reduced outstanding shares by more than 4%.
- Q3 2025 Oil Production: 505 MBbl.
- Q3 2025 Gas Production: 2.3 Bcf.
- Nine-Month 2025 Total Revenues: $138.0 million.
PrimeEnergy Resources Corporation (PNRG) - Porter's Five Forces: Threat of substitutes
You're looking at the landscape for PrimeEnergy Resources Corporation (PNRG), and the biggest headwind from outside the traditional oil and gas sphere is definitely the push toward cleaner power. The primary substitute for the hydrocarbons PrimeEnergy Resources Corporation (PNRG) produces-crude oil and natural gas-is renewable energy, specifically solar and wind. This isn't just a distant concept; it's a growing, long-term threat that is actively reshaping the power sector. In 2024, wind and solar generation combined hit a record 17% of US electricity, finally surpassing coal at 15% for the first time. Looking forward, the US renewable energy market is projected to grow from US$ 429.55 Gigawatt in 2024 to US$ 1,002.13 Gigawatt by 2033. Even with policy shifts in 2025 that rolled back tax credits, renewables still dominated US capacity additions, making up 93% of the 30.2 gigawatts added through September 2025.
Government policies create a complex, shifting environment for substitutes. While the 2025 administration rescinded climate-related executive orders and withdrew from the Paris Agreement, focusing on expanding fossil fuel production, the underlying push for cleaner sources remains strong in other areas. For instance, the Office of Energy Efficiency and Renewable Energy (EERE) continues to fund research and development aimed at a 100% clean energy economy by 2050. However, the passage of the One Big Beautiful Bill Act ended many clean energy tax credits that previously supported the sector. This policy tug-of-war means the speed of substitution isn't linear; investments in wind and solar in the first half of 2025 fell 18% to nearly US$35 billion compared to H1 2024.
For PrimeEnergy Resources Corporation (PNRG)'s natural gas segment, substitution pressure comes from both coal and nuclear, with price being the key variable. In September 2025, the Henry Hub natural gas price was $2.96/MMBtu, which was below the Central Appalachian coal price of $33.91/MWh when calculated on an equivalent energy content and efficiency basis. Coal's share in the power mix has been falling for years, partly due to cheaper gas, but the new administration is calling for a return to coal, though utility companies seem hesitant. Nuclear power's competitiveness is directly tied to gas prices; lower natural gas prices lead to more nuclear retirements, while higher prices can help keep the existing fleet running.
Here's a quick look at how the competition stacks up in the power generation space as of late 2025, based on 2024 generation shares and September 2025 fuel prices:
| Fuel Source | 2024 US Electricity Generation Share (Approx.) | September 2025 Fuel Price (Representative) | Substitution Pressure on Natural Gas |
|---|---|---|---|
| Natural Gas | 42.9% | Henry Hub: $2.96/MMBtu | Baseline Competitor |
| Renewables (Solar/Wind/Hydro) | 24% | New Solar Cost Competitive with Existing Fossil | High, Driven by falling technology costs and capacity additions |
| Nuclear | Approx. 17.4% (781 TWh / 4,393 TWh) | Highly sensitive to Natural Gas prices | Moderate; dependent on policy and gas price volatility |
| Coal | 14.7% | Central Appalachian: $33.91/MWh (Equivalent basis) | Low to Moderate; facing economic headwinds despite policy support |
For PrimeEnergy Resources Corporation (PNRG), you must remember that its core business is firmly rooted in E&P-exploration and production of crude oil and natural gas. Their Q3 2025 production figures show this clearly: 505 MBbl of oil and 2.3 Bcf of natural gas for the quarter. While the company maintains a strong balance sheet with zero outstanding bank debt as of September 30, 2025, and full availability on its $115 million revolving credit facility, this financial strength supports the core hydrocarbon business, not a significant pivot to renewables.
Finally, energy efficiency improvements across end-user sectors act as a constant, slow drain on demand for your products. This is a structural headwind you can't easily fight with production volume alone. For example, in 2024, factors like tighter vehicle efficiency standards and the higher share of EVs meant US oil demand remained 4.3% lower than its 2019 level. More recently, total petroleum product supplied in late 2025 averaged 20.6 million barrels per day, representing only a marginal 0.2% decline year-over-year, suggesting stable but not expanding consumption intensity. Refiners, facing energy costs that can be 30-50% of their total operational expenditures, are aggressively pursuing efficiency gains, which further limits the growth in demand for raw fuels like oil.
- Oil demand in advanced economies fell by 0.1% in 2024.
- PNRG retired 73,470 shares year-to-date in 2025, reducing outstanding shares by over 4%.
- The cost of new solar electricity is now cost-competitive with existing fossil generation in many US regions.
- The administration has paused permitting for wind and solar projects on federal lands in 2025.
- PNRG's Q3 2025 total oil, gas, and NGL revenue was $45.97 million.
PrimeEnergy Resources Corporation (PNRG) - Porter's Five Forces: Threat of new entrants
You're looking at the barriers to entry for a new oil and gas player trying to muscle into PrimeEnergy Resources Corporation's turf in Texas and Oklahoma as of late 2025. Honestly, the upfront cost alone is a massive hurdle.
Capital intensity is a major barrier, with PrimeEnergy Resources Corporation planning to have invested roughly $338 million in horizontal development in the West Texas Midland Basin from January 2023 through 2025 alone. If you look further back, since starting horizontal drilling activities in 2012, PrimeEnergy Resources Corporation has poured over $430 million into West Texas and another $45 million into Oklahoma. That kind of capital deployment is not something a startup can easily match overnight.
Significant regulatory hurdles and complex permitting processes slow down new players defintely. While the regulatory environment is shifting-the proposed revision to the "waters of the United States" (WOTUS) definition in November 2025 could potentially slash permitting timelines by 30-50% in high-impact states like Texas- the baseline complexity remains high. Furthermore, Texas is implementing new rules; Senate Bill 1150 requires operators to plug wells inactive for at least 15 years, with enforcement starting in September 2027. Navigating these state and federal requirements requires established expertise.
New entrants face difficulty securing access to existing pipeline infrastructure and distribution networks. The Permian Basin is seeing a pipeline buildout, with 12 projects for new or expanded gas pipelines set to be completed in Texas, Louisiana, and Oklahoma in the coming year (2026). Still, existing infrastructure is clearly strained; limited available spare pipeline capacity has caused prices at the Waha gas hub in West Texas to crash into negative territory multiple times recently. An established player like PrimeEnergy Resources Corporation, with existing operational relationships, has a significant advantage over a newcomer needing to negotiate new takeaway capacity.
PrimeEnergy Resources Corporation's established leasehold and mineral interests in Texas and Oklahoma are difficult to replicate. PrimeEnergy Resources Corporation operates approximately 507 active wells and owns non-operating interests in approximately 1054 additional wells primarily across these two states. In the core West Texas Permian Basin, the Company maintains about 17,138 gross acres. Acquiring this depth of acreage and operational footprint takes years and significant upfront capital outlay.
Economies of scale favor established operators in drilling and production costs. The sheer volume of capital deployed by PrimeEnergy Resources Corporation-over $430 million in West Texas since 2012- allows them to negotiate better rates for services and secure favorable terms with drilling partners, like the participation in 21 horizontal wells in mid-2024 that required an estimated investment of $68.5 million for those specific wells. This scale translates directly into lower per-unit costs for new development.
Here's a quick look at the scale of PrimeEnergy Resources Corporation's existing footprint:
| Asset Category | Metric | Value |
|---|---|---|
| West Texas Acreage (Gross) | Permian Basin Position | 17,138 acres |
| Total Active Wells | Owned/Operated | 507 wells |
| Total Non-Operating Interests | Additional Wells Owned | 1054 wells |
| Historical West Texas CapEx | Since 2012 | Over $430 million |
| Liquidity Position (9/30/2025) | Bank Debt | Zero |
The ability to fund development without bank debt, holding $115 million fully available on its credit facility as of September 30, 2025, gives PrimeEnergy Resources Corporation a financial stability that new entrants, likely reliant on external financing, will struggle to match in securing long-term drilling commitments.
Disclaimer
All information, articles, and product details provided on this website are for general informational and educational purposes only. We do not claim any ownership over, nor do we intend to infringe upon, any trademarks, copyrights, logos, brand names, or other intellectual property mentioned or depicted on this site. Such intellectual property remains the property of its respective owners, and any references here are made solely for identification or informational purposes, without implying any affiliation, endorsement, or partnership.
We make no representations or warranties, express or implied, regarding the accuracy, completeness, or suitability of any content or products presented. Nothing on this website should be construed as legal, tax, investment, financial, medical, or other professional advice. In addition, no part of this site—including articles or product references—constitutes a solicitation, recommendation, endorsement, advertisement, or offer to buy or sell any securities, franchises, or other financial instruments, particularly in jurisdictions where such activity would be unlawful.
All content is of a general nature and may not address the specific circumstances of any individual or entity. It is not a substitute for professional advice or services. Any actions you take based on the information provided here are strictly at your own risk. You accept full responsibility for any decisions or outcomes arising from your use of this website and agree to release us from any liability in connection with your use of, or reliance upon, the content or products found herein.