
|
Prestige Estates Projects Limited (Prestige.ns) Valoración de DCF |
Completamente Editable: Adáptelo A Sus Necesidades En Excel O Sheets
Diseño Profesional: Plantillas Confiables Y Estándares De La Industria
Predeterminadas Para Un Uso Rápido Y Eficiente
Compatible con MAC / PC, completamente desbloqueado
No Se Necesita Experiencia; Fáciles De Seguir
Prestige Estates Projects Limited (PRESTIGE.NS) Bundle
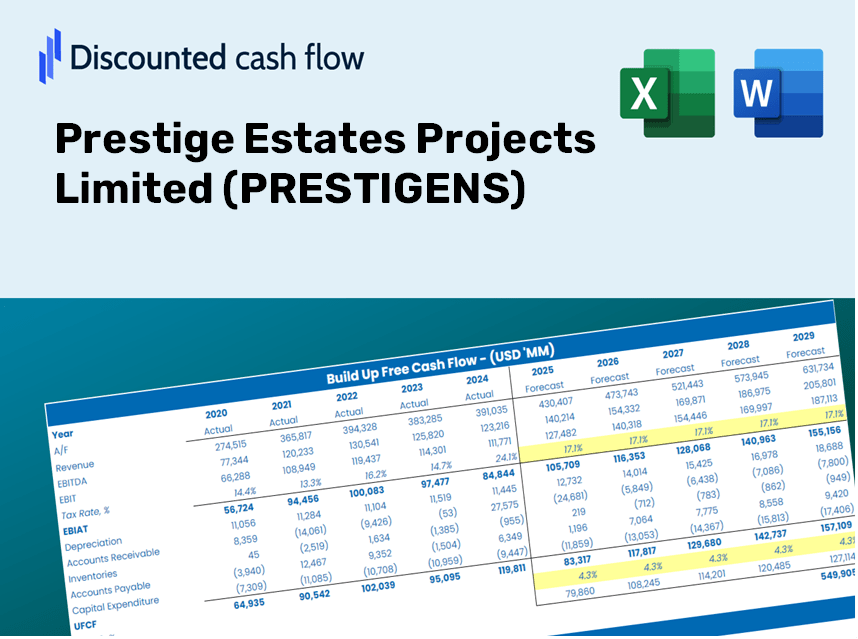
¡Obtenga dominio sobre su análisis de valoración Limited (Prestigens) Limited (Prestigens) con nuestra calculadora DCF de vanguardia! Precedido con datos reales (prestigios), esta plantilla de Excel le permite ajustar los pronósticos y supuestos para determinar con precisión el valor intrínseco de los proyectos de estates de prestigio limitados.
What You Will Receive
- Pre-Filled Financial Model: Utilize Prestige Estates Projects Limited’s (PRESTIGENS) real data for accurate DCF valuation.
- Complete Forecast Control: Modify revenue growth, profit margins, WACC, and other crucial factors.
- Immediate Calculations: Automatic updates provide instant insights as you make adjustments.
- Professional-Grade Template: An advanced Excel file crafted for high-level valuation.
- Flexible and Reusable: Customized for adaptability, enabling repeated application for in-depth forecasts.
Key Features
- Pre-Loaded Data: PRESTIGENS' historical financial statements and pre-filled forecasts.
- Fully Adjustable Inputs: Customize WACC, tax rates, revenue growth, and EBITDA margins.
- Instant Results: View PRESTIGENS' intrinsic value recalculated in real time.
- Clear Visual Outputs: Dashboard charts showcase valuation results and essential metrics.
- Built for Accuracy: A professional tool designed for analysts, investors, and finance professionals.
How It Functions
- 1. Open the Template: Download and access the Excel file featuring Prestige Estates Projects Limited's (PRESTIGENS) preloaded data.
- 2. Modify Assumptions: Adjust key parameters such as growth rates, WACC, and capital expenditures.
- 3. View Results Instantly: The DCF model automatically computes intrinsic value and NPV in real-time.
- 4. Explore Scenarios: Evaluate various forecasts to assess different valuation results.
- 5. Present with Assurance: Deliver professional valuation insights to inform your decision-making.
Why Choose the PRESTIGENS Calculator?
- Tailored for Experts: A sophisticated tool designed for analysts, investors, and real estate professionals.
- Comprehensive Data: PRESTIGENS's historical and projected financials are readily available to ensure precision.
- Versatile Scenario Analysis: Effortlessly model various forecasts and assumptions.
- Insightful Outputs: Instantly calculates intrinsic value, NPV, and essential financial metrics.
- User-Friendly: Step-by-step guidance walks you through every detail of the process.
Who Should Utilize This Product?
- Investors: Accurately assess the fair value of Prestige Estates Projects Limited (PRESTIGENS) before making investment choices.
- CFOs: Utilize a professional-grade DCF model for comprehensive financial reporting and analysis.
- Consultants: Swiftly modify the template for clients' valuation reports.
- Entrepreneurs: Acquire insights into the financial modeling practices employed by leading real estate firms.
- Educators: Employ it as a teaching resource to illustrate various valuation methodologies.
Contents of the Template
- Preloaded PRESTIGENS Data: Historical and projected financial figures, such as revenue, EBIT, and capital expenditures.
- DCF and WACC Models: Advanced spreadsheets designed for calculating intrinsic value and Weighted Average Cost of Capital.
- Editable Inputs: Cells highlighted in yellow for modifying revenue growth, tax rates, and discount rates.
- Financial Statements: Detailed annual and quarterly financials for in-depth analysis.
- Key Ratios: Metrics for profitability, leverage, and efficiency to assess performance.
- Dashboard and Charts: Visual representations of valuation results and underlying assumptions.
Disclaimer
All information, articles, and product details provided on this website are for general informational and educational purposes only. We do not claim any ownership over, nor do we intend to infringe upon, any trademarks, copyrights, logos, brand names, or other intellectual property mentioned or depicted on this site. Such intellectual property remains the property of its respective owners, and any references here are made solely for identification or informational purposes, without implying any affiliation, endorsement, or partnership.
We make no representations or warranties, express or implied, regarding the accuracy, completeness, or suitability of any content or products presented. Nothing on this website should be construed as legal, tax, investment, financial, medical, or other professional advice. In addition, no part of this site—including articles or product references—constitutes a solicitation, recommendation, endorsement, advertisement, or offer to buy or sell any securities, franchises, or other financial instruments, particularly in jurisdictions where such activity would be unlawful.
All content is of a general nature and may not address the specific circumstances of any individual or entity. It is not a substitute for professional advice or services. Any actions you take based on the information provided here are strictly at your own risk. You accept full responsibility for any decisions or outcomes arising from your use of this website and agree to release us from any liability in connection with your use of, or reliance upon, the content or products found herein.