
|
Valoración DCF de Park National Corporation (PRK) |
Completamente Editable: Adáptelo A Sus Necesidades En Excel O Sheets
Diseño Profesional: Plantillas Confiables Y Estándares De La Industria
Predeterminadas Para Un Uso Rápido Y Eficiente
Compatible con MAC / PC, completamente desbloqueado
No Se Necesita Experiencia; Fáciles De Seguir
Park National Corporation (PRK) Bundle
Ya sea que sea un inversor o analista, esta calculadora DCF (PRK) es su recurso de referencia para una valoración precisa. Equipado con datos reales de Park National Corporation, puede ajustar los pronósticos y observar los efectos en tiempo real.
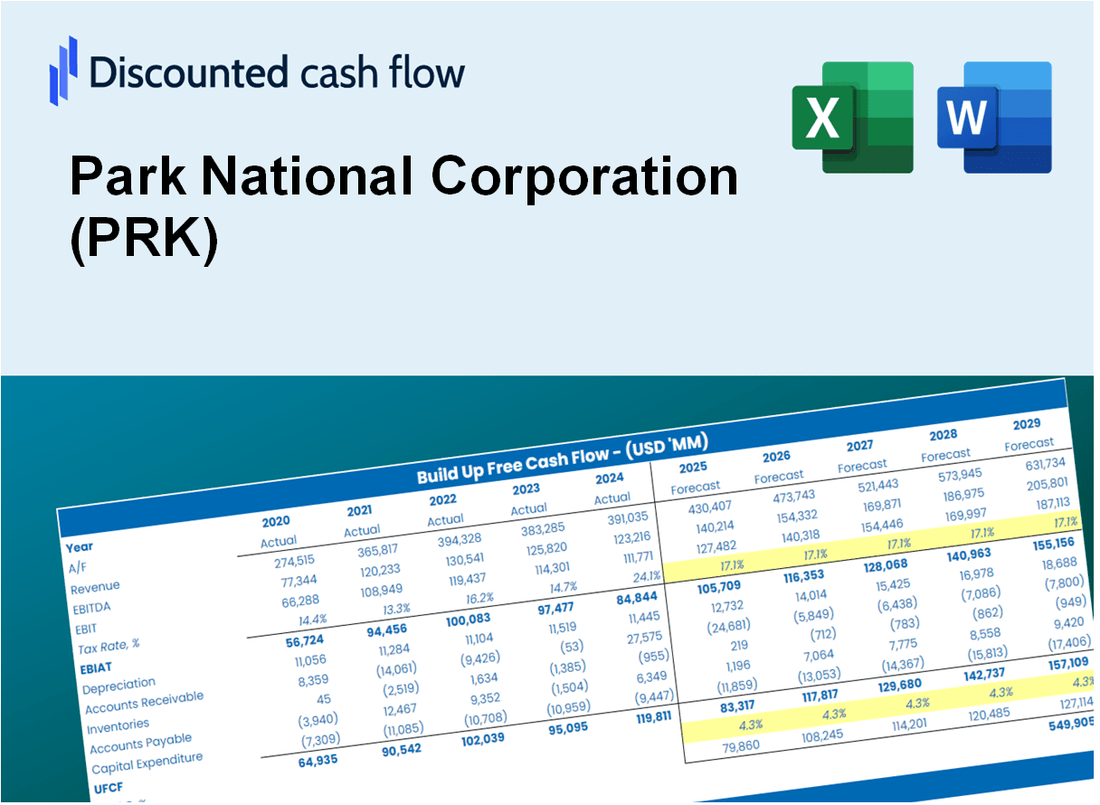
Discounted Cash Flow (DCF) - (USD MM)
| Year | AY1 2020 |
AY2 2021 |
AY3 2022 |
AY4 2023 |
AY5 2024 |
FY1 2025 |
FY2 2026 |
FY3 2027 |
FY4 2028 |
FY5 2029 |
|---|---|---|---|---|---|---|---|---|---|---|
| Revenue | 441.2 | 475.8 | 514.2 | 564.3 | 645.6 | 710.2 | 781.3 | 859.5 | 945.5 | 1,040.2 |
| Revenue Growth, % | 0 | 7.83 | 8.07 | 9.75 | 14.4 | 10.01 | 10.01 | 10.01 | 10.01 | 10.01 |
| EBITDA | 165.2 | 187.5 | 194.3 | 167.6 | 196.9 | 248.3 | 273.2 | 300.5 | 330.6 | 363.7 |
| EBITDA, % | 37.43 | 39.4 | 37.78 | 29.7 | 30.5 | 34.96 | 34.96 | 34.96 | 34.96 | 34.96 |
| Depreciation | .0 | 15.1 | 13.8 | 14.0 | 12.2 | 14.5 | 16.0 | 17.6 | 19.4 | 21.3 |
| Depreciation, % | 0 | 3.17 | 2.69 | 2.48 | 1.89 | 2.05 | 2.05 | 2.05 | 2.05 | 2.05 |
| EBIT | 165.2 | 172.4 | 180.5 | 153.6 | 184.7 | 233.8 | 257.2 | 282.9 | 311.3 | 342.4 |
| EBIT, % | 37.43 | 36.23 | 35.1 | 27.22 | 28.62 | 32.92 | 32.92 | 32.92 | 32.92 | 32.92 |
| Total Cash | 1,429.8 | 1,973.3 | 1,923.4 | 1,551.1 | 1,157.2 | 710.2 | 781.3 | 859.5 | 945.5 | 1,040.2 |
| Total Cash, percent | .0 | .0 | .0 | .0 | .0 | .0 | .0 | .0 | .0 | .0 |
| Account Receivables | 49.4 | 20.5 | 34.7 | 63.3 | 66.1 | 62.1 | 68.3 | 75.1 | 82.6 | 90.9 |
| Account Receivables, % | 11.19 | 4.32 | 6.75 | 11.21 | 10.24 | 8.74 | 8.74 | 8.74 | 8.74 | 8.74 |
| Inventories | .0 | .0 | .0 | .0 | .0 | .0 | .0 | .0 | .0 | .0 |
| Inventories, % | 0 | 0 | 0 | 0 | 0 | 0 | 0 | 0 | 0 | 0 |
| Accounts Payable | 3.9 | 3.1 | 3.5 | 6.9 | 7.9 | 6.6 | 7.3 | 8.0 | 8.8 | 9.7 |
| Accounts Payable, % | 0.87481 | 0.6549 | 0.67797 | 1.22 | 1.22 | 0.92815 | 0.92815 | 0.92815 | 0.92815 | 0.92815 |
| Capital Expenditure | -28.6 | -14.1 | -7.9 | -7.6 | -9.2 | -19.5 | -21.5 | -23.7 | -26.0 | -28.6 |
| Capital Expenditure, % | -6.49 | -2.96 | -1.54 | -1.34 | -1.42 | -2.75 | -2.75 | -2.75 | -2.75 | -2.75 |
| Tax Rate, % | 18.03 | 18.03 | 18.03 | 18.03 | 18.03 | 18.03 | 18.03 | 18.03 | 18.03 | 18.03 |
| EBITAT | 136.6 | 141.0 | 148.4 | 126.7 | 151.4 | 192.3 | 211.5 | 232.7 | 256.0 | 281.6 |
| Depreciation | ||||||||||
| Changes in Account Receivables | ||||||||||
| Changes in Inventories | ||||||||||
| Changes in Accounts Payable | ||||||||||
| Capital Expenditure | ||||||||||
| UFCF | 62.5 | 170.1 | 140.4 | 108.0 | 152.6 | 190.0 | 200.4 | 220.5 | 242.6 | 266.9 |
| WACC, % | 10.07 | 10.02 | 10.04 | 10.06 | 10.03 | 10.04 | 10.04 | 10.04 | 10.04 | 10.04 |
| PV UFCF | ||||||||||
| SUM PV UFCF | 834.4 | |||||||||
| Long Term Growth Rate, % | 2.00 | |||||||||
| Free cash flow (T + 1) | 272 | |||||||||
| Terminal Value | 3,384 | |||||||||
| Present Terminal Value | 2,097 | |||||||||
| Enterprise Value | 2,931 | |||||||||
| Net Debt | 136 | |||||||||
| Equity Value | 2,795 | |||||||||
| Diluted Shares Outstanding, MM | 16 | |||||||||
| Equity Value Per Share | 172.07 |
What You Will Get
- Accurate PRK Financials: Access to historical and projected data for precise valuation.
- Customizable Parameters: Adjust WACC, tax rates, revenue growth, and capital expenditures as needed.
- Dynamic Calculations: Intrinsic value and NPV are computed in real-time.
- Scenario Testing: Explore various scenarios to assess Park National Corporation's future performance.
- User-Friendly Interface: Designed for finance professionals while remaining approachable for newcomers.
Key Features
- Comprehensive DCF Calculator: Features detailed unlevered and levered DCF valuation models tailored for Park National Corporation (PRK).
- WACC Calculator: Pre-configured Weighted Average Cost of Capital sheet with adjustable inputs specific to Park National Corporation (PRK).
- Customizable Forecast Assumptions: Easily modify growth rates, capital expenditures, and discount rates to fit Park National Corporation (PRK).
- Integrated Financial Ratios: Evaluate profitability, leverage, and efficiency ratios relevant to Park National Corporation (PRK).
- Interactive Dashboard and Charts: Visual representations that summarize essential valuation metrics for straightforward analysis of Park National Corporation (PRK).
How It Works
- Step 1: Download the prebuilt Excel template featuring Park National Corporation’s (PRK) data.
- Step 2: Navigate through the pre-filled sheets to familiarize yourself with the key metrics.
- Step 3: Adjust forecasts and assumptions in the editable yellow cells (WACC, growth, margins).
- Step 4: Instantly see recalculated results, including Park National Corporation’s (PRK) intrinsic value.
- Step 5: Make well-informed investment decisions or create reports using the generated outputs.
Why Choose This Calculator for Park National Corporation (PRK)?
- All-in-One Solution: Features DCF, WACC, and financial ratio analyses tailored for Park National Corporation (PRK).
- Flexible Inputs: Modify yellow-highlighted cells to explore different financial scenarios.
- In-Depth Analysis: Automatically computes Park National Corporation’s (PRK) intrinsic value and Net Present Value.
- Ready-to-Use Data: Comes with historical and projected data for reliable analysis.
- High-Quality Standards: Perfect for financial analysts, investors, and business consultants focusing on Park National Corporation (PRK).
Who Should Use This Product?
- Investors: Accurately assess Park National Corporation’s (PRK) fair value prior to making investment choices.
- CFOs: Utilize a high-quality DCF model for financial reporting and strategic analysis.
- Consultants: Easily customize the template for valuation reports tailored to clients.
- Entrepreneurs: Acquire knowledge of financial modeling techniques employed by leading firms.
- Educators: Implement it as a resource to illustrate valuation methodologies in the classroom.
What the Template Contains
- Historical Data: Includes Park National Corporation’s (PRK) past financials and baseline forecasts.
- DCF and Levered DCF Models: Detailed templates to calculate Park National Corporation’s (PRK) intrinsic value.
- WACC Sheet: Pre-built calculations for Weighted Average Cost of Capital.
- Editable Inputs: Modify key drivers like growth rates, EBITDA %, and CAPEX assumptions.
- Quarterly and Annual Statements: A complete breakdown of Park National Corporation’s (PRK) financials.
- Interactive Dashboard: Visualize valuation results and projections dynamically.
Disclaimer
All information, articles, and product details provided on this website are for general informational and educational purposes only. We do not claim any ownership over, nor do we intend to infringe upon, any trademarks, copyrights, logos, brand names, or other intellectual property mentioned or depicted on this site. Such intellectual property remains the property of its respective owners, and any references here are made solely for identification or informational purposes, without implying any affiliation, endorsement, or partnership.
We make no representations or warranties, express or implied, regarding the accuracy, completeness, or suitability of any content or products presented. Nothing on this website should be construed as legal, tax, investment, financial, medical, or other professional advice. In addition, no part of this site—including articles or product references—constitutes a solicitation, recommendation, endorsement, advertisement, or offer to buy or sell any securities, franchises, or other financial instruments, particularly in jurisdictions where such activity would be unlawful.
All content is of a general nature and may not address the specific circumstances of any individual or entity. It is not a substitute for professional advice or services. Any actions you take based on the information provided here are strictly at your own risk. You accept full responsibility for any decisions or outcomes arising from your use of this website and agree to release us from any liability in connection with your use of, or reliance upon, the content or products found herein.