
|
Valoración DCF de Perimeter Solutions, SA (PRM) |
Completamente Editable: Adáptelo A Sus Necesidades En Excel O Sheets
Diseño Profesional: Plantillas Confiables Y Estándares De La Industria
Predeterminadas Para Un Uso Rápido Y Eficiente
Compatible con MAC / PC, completamente desbloqueado
No Se Necesita Experiencia; Fáciles De Seguir
Perimeter Solutions, SA (PRM) Bundle
¡Optimice su tiempo y mejore la precisión con nuestra calculadora DCF (PRM)! Utilizando datos reales de soluciones perimetrales, SA y supuestos personalizables, esta herramienta le permite pronosticar, analizar y evaluar (PRM) al igual que un inversor experimentado.
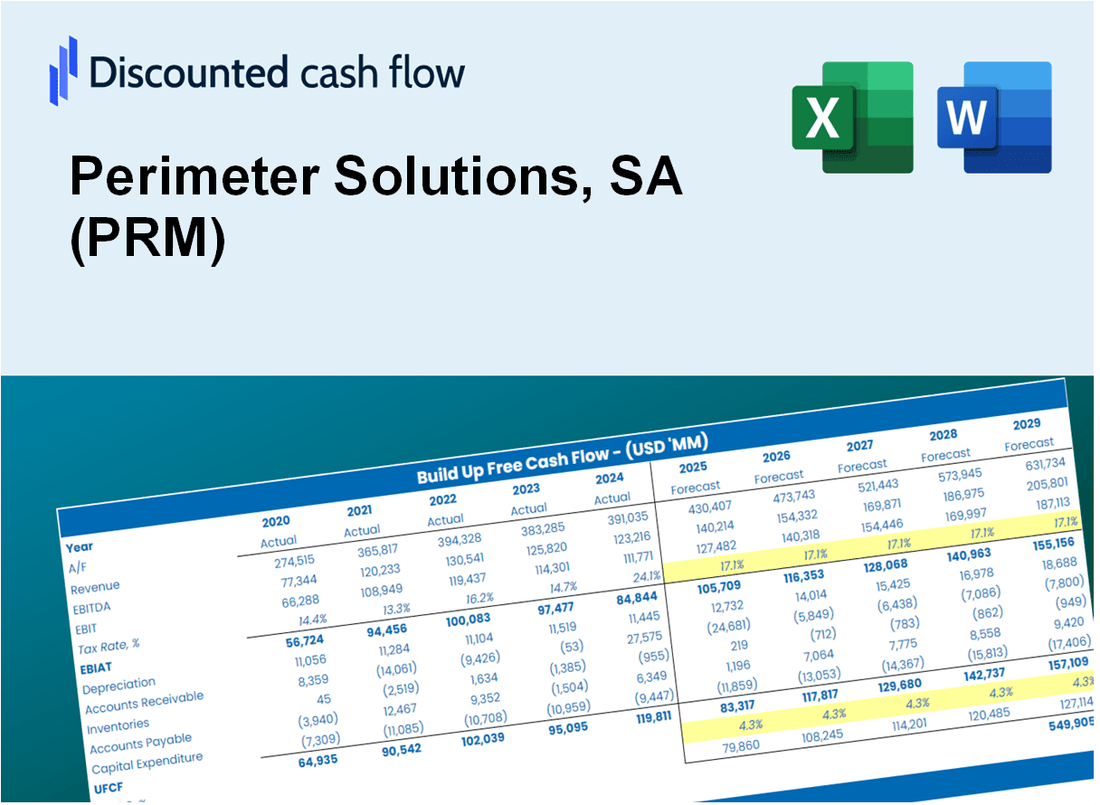
Discounted Cash Flow (DCF) - (USD MM)
| Year | AY1 2020 |
AY2 2021 |
AY3 2022 |
AY4 2023 |
AY5 2024 |
FY1 2025 |
FY2 2026 |
FY3 2027 |
FY4 2028 |
FY5 2029 |
|---|---|---|---|---|---|---|---|---|---|---|
| Revenue | 339.6 | 362.3 | 360.5 | 322.1 | 561.0 | 658.7 | 773.5 | 908.3 | 1,066.6 | 1,252.4 |
| Revenue Growth, % | 0 | 6.7 | -0.50588 | -10.65 | 74.16 | 17.43 | 17.43 | 17.43 | 17.43 | 17.43 |
| EBITDA | 129.6 | -529.5 | 195.9 | 200.0 | 62.0 | 86.5 | 101.5 | 119.2 | 140.0 | 164.4 |
| EBITDA, % | 38.16 | -146.14 | 54.33 | 62.1 | 11.04 | 13.13 | 13.13 | 13.13 | 13.13 | 13.13 |
| Depreciation | 58.1 | 61.4 | 65.8 | 64.9 | 65.7 | 110.9 | 130.2 | 152.9 | 179.5 | 210.8 |
| Depreciation, % | 17.11 | 16.94 | 18.25 | 20.13 | 11.72 | 16.83 | 16.83 | 16.83 | 16.83 | 16.83 |
| EBIT | 71.5 | -590.9 | 130.1 | 135.2 | -3.8 | -2.1 | -2.4 | -2.9 | -3.4 | -3.9 |
| EBIT, % | 21.05 | -163.08 | 36.08 | 41.97 | -0.67152 | -0.31493 | -0.31493 | -0.31493 | -0.31493 | -0.31493 |
| Total Cash | 22.5 | 225.6 | 126.8 | 52.8 | 198.5 | 205.3 | 241.0 | 283.0 | 332.3 | 390.2 |
| Total Cash, percent | .0 | .0 | .0 | .0 | .0 | .0 | .0 | .0 | .0 | .0 |
| Account Receivables | 40.4 | 25.1 | 26.9 | 41.3 | 67.1 | 67.3 | 79.0 | 92.8 | 108.9 | 127.9 |
| Account Receivables, % | 11.88 | 6.94 | 7.45 | 12.82 | 11.97 | 10.21 | 10.21 | 10.21 | 10.21 | 10.21 |
| Inventories | 58.8 | 110.1 | 143.0 | 145.7 | 116.3 | 202.0 | 237.2 | 278.5 | 327.0 | 384.0 |
| Inventories, % | 17.31 | 30.38 | 39.66 | 45.22 | 20.74 | 30.66 | 30.66 | 30.66 | 30.66 | 30.66 |
| Accounts Payable | 9.9 | 27.5 | 36.8 | 21.6 | 23.5 | 41.6 | 48.9 | 57.4 | 67.4 | 79.2 |
| Accounts Payable, % | 2.91 | 7.58 | 10.21 | 6.72 | 4.19 | 6.32 | 6.32 | 6.32 | 6.32 | 6.32 |
| Capital Expenditure | -7.5 | -9.8 | -8.6 | -9.4 | -15.5 | -17.1 | -20.1 | -23.6 | -27.7 | -32.5 |
| Capital Expenditure, % | -2.21 | -2.69 | -2.39 | -2.93 | -2.77 | -2.6 | -2.6 | -2.6 | -2.6 | -2.6 |
| Tax Rate, % | 87.4 | 87.4 | 87.4 | 87.4 | 87.4 | 87.4 | 87.4 | 87.4 | 87.4 | 87.4 |
| EBITAT | 49.9 | -598.1 | 122.7 | 148.1 | -.5 | -1.6 | -1.8 | -2.2 | -2.5 | -3.0 |
| Depreciation | ||||||||||
| Changes in Account Receivables | ||||||||||
| Changes in Inventories | ||||||||||
| Changes in Accounts Payable | ||||||||||
| Capital Expenditure | ||||||||||
| UFCF | 11.3 | -565.0 | 154.7 | 171.3 | 55.1 | 24.6 | 68.6 | 80.6 | 94.6 | 111.1 |
| WACC, % | 11.37 | 11.64 | 11.59 | 11.64 | 10.85 | 11.42 | 11.42 | 11.42 | 11.42 | 11.42 |
| PV UFCF | ||||||||||
| SUM PV UFCF | 261.6 | |||||||||
| Long Term Growth Rate, % | 0.50 | |||||||||
| Free cash flow (T + 1) | 112 | |||||||||
| Terminal Value | 1,023 | |||||||||
| Present Terminal Value | 596 | |||||||||
| Enterprise Value | 857 | |||||||||
| Net Debt | 607 | |||||||||
| Equity Value | 250 | |||||||||
| Diluted Shares Outstanding, MM | 146 | |||||||||
| Equity Value Per Share | 1.72 |
What You Will Get
- Authentic PRM Financial Data: Pre-loaded with Perimeter Solutions’ historical and projected figures for accurate analysis.
- Completely Customizable Template: Easily adjust key inputs such as revenue growth, WACC, and EBITDA %.
- Instant Calculations: Watch PRM’s intrinsic value change in real-time as you make adjustments.
- Professional Valuation Tool: Tailored for investors, analysts, and consultants looking for precise DCF outcomes.
- Intuitive Design: User-friendly layout and straightforward instructions suitable for all skill levels.
Key Features
- Customizable Financial Inputs: Adjust essential metrics such as revenue projections, EBITDA margins, and capital investments.
- Instant DCF Valuation: Automatically computes intrinsic value, net present value (NPV), and additional financial outputs.
- High-Precision Accuracy: Leverages Perimeter Solutions' real-world financial data for credible valuation results.
- Effortless Scenario Testing: Easily experiment with various assumptions and analyze the resulting impacts.
- Efficiency Booster: Streamline the valuation process without the hassle of creating intricate models from the ground up.
How It Works
- Step 1: Download the Excel file.
- Step 2: Review pre-entered Perimeter Solutions data (historical and projected).
- Step 3: Adjust key assumptions (yellow cells) based on your analysis.
- Step 4: View automatic recalculations for Perimeter Solutions’ intrinsic value.
- Step 5: Use the outputs for investment decisions or reporting.
Why Choose This Calculator for Perimeter Solutions, SA (PRM)?
- All-in-One Solution: Features DCF, WACC, and financial ratio analyses tailored for PRM.
- Flexible Inputs: Modify the highlighted cells to explore different financial scenarios.
- In-Depth Analysis: Automatically computes Perimeter Solutions’ intrinsic value and Net Present Value.
- Preloaded Information: Access historical and projected data for reliable baselines.
- Expert-Level Tool: Perfect for financial analysts, investors, and business advisors focusing on PRM.
Who Should Use Perimeter Solutions, SA (PRM)?
- Investors: Make informed investment choices with insights from a leading provider in fire safety solutions.
- Risk Management Professionals: Enhance your strategies with advanced products designed for effective risk mitigation.
- Consultants: Easily tailor presentations and reports with data from a trusted industry leader.
- Environmental Advocates: Learn about sustainable solutions in fire protection that prioritize safety and ecology.
- Educators and Students: Utilize the company's resources for hands-on learning in environmental science and safety management.
What the Template Contains
- Preloaded PRM Data: Historical and projected financial data, including revenue, EBIT, and capital expenditures.
- DCF and WACC Models: Professional-grade sheets for calculating intrinsic value and Weighted Average Cost of Capital.
- Editable Inputs: Yellow-highlighted cells for adjusting revenue growth, tax rates, and discount rates.
- Financial Statements: Comprehensive annual and quarterly financials for deeper analysis.
- Key Ratios: Profitability, leverage, and efficiency ratios to evaluate performance.
- Dashboard and Charts: Visual summaries of valuation outcomes and assumptions.
Disclaimer
All information, articles, and product details provided on this website are for general informational and educational purposes only. We do not claim any ownership over, nor do we intend to infringe upon, any trademarks, copyrights, logos, brand names, or other intellectual property mentioned or depicted on this site. Such intellectual property remains the property of its respective owners, and any references here are made solely for identification or informational purposes, without implying any affiliation, endorsement, or partnership.
We make no representations or warranties, express or implied, regarding the accuracy, completeness, or suitability of any content or products presented. Nothing on this website should be construed as legal, tax, investment, financial, medical, or other professional advice. In addition, no part of this site—including articles or product references—constitutes a solicitation, recommendation, endorsement, advertisement, or offer to buy or sell any securities, franchises, or other financial instruments, particularly in jurisdictions where such activity would be unlawful.
All content is of a general nature and may not address the specific circumstances of any individual or entity. It is not a substitute for professional advice or services. Any actions you take based on the information provided here are strictly at your own risk. You accept full responsibility for any decisions or outcomes arising from your use of this website and agree to release us from any liability in connection with your use of, or reliance upon, the content or products found herein.