
|
Valoración DCF de CarParts.com, Inc. (PRTS) |
Completamente Editable: Adáptelo A Sus Necesidades En Excel O Sheets
Diseño Profesional: Plantillas Confiables Y Estándares De La Industria
Predeterminadas Para Un Uso Rápido Y Eficiente
Compatible con MAC / PC, completamente desbloqueado
No Se Necesita Experiencia; Fáciles De Seguir
CarParts.com, Inc. (PRTS) Bundle
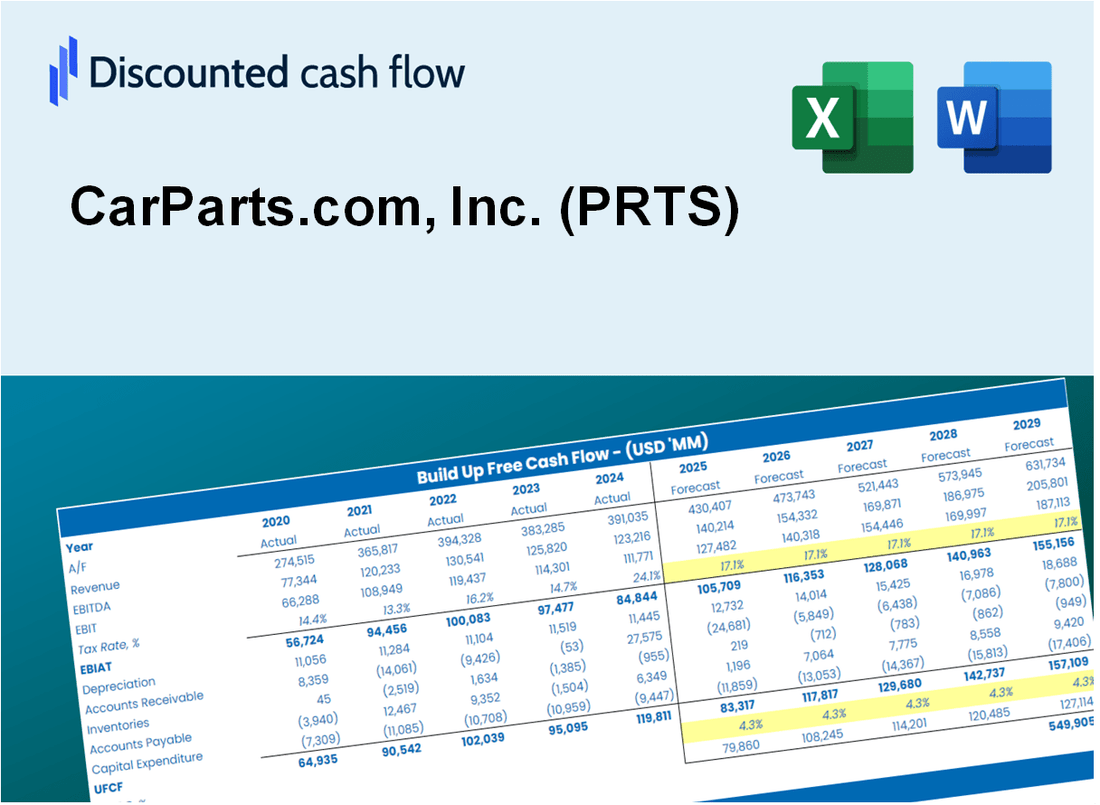
Ya sea que sea un inversionista o analista, esta calculadora DCF (PRTS) es su recurso para una valoración precisa. Cargados con datos reales de Carpararts.com, Inc., puede ajustar previsiones e inmediatamente observar los efectos.
Discounted Cash Flow (DCF) - (USD MM)
| Year | AY1 2020 |
AY2 2021 |
AY3 2022 |
AY4 2023 |
AY5 2024 |
FY1 2025 |
FY2 2026 |
FY3 2027 |
FY4 2028 |
FY5 2029 |
|---|---|---|---|---|---|---|---|---|---|---|
| Revenue | 443.9 | 582.4 | 661.6 | 675.7 | 588.8 | 639.0 | 693.5 | 752.6 | 816.7 | 886.3 |
| Revenue Growth, % | 0 | 31.21 | 13.59 | 2.13 | -12.86 | 8.52 | 8.52 | 8.52 | 8.52 | 8.52 |
| EBITDA | 8.3 | 1.1 | 14.8 | 10.0 | -20.1 | 3.0 | 3.3 | 3.6 | 3.9 | 4.2 |
| EBITDA, % | 1.86 | 0.19435 | 2.24 | 1.49 | -3.41 | 0.4752 | 0.4752 | 0.4752 | 0.4752 | 0.4752 |
| Depreciation | 7.8 | 10.0 | 13.7 | 16.7 | 19.1 | 14.4 | 15.6 | 16.9 | 18.4 | 20.0 |
| Depreciation, % | 1.75 | 1.72 | 2.07 | 2.48 | 3.24 | 2.25 | 2.25 | 2.25 | 2.25 | 2.25 |
| EBIT | .5 | -8.9 | 1.1 | -6.7 | -39.2 | -11.4 | -12.3 | -13.4 | -14.5 | -15.7 |
| EBIT, % | 0.11444 | -1.52 | 0.16898 | -0.98915 | -6.65 | -1.78 | -1.78 | -1.78 | -1.78 | -1.78 |
| Total Cash | 35.8 | 18.1 | 18.8 | 51.0 | 36.4 | 35.5 | 38.5 | 41.7 | 45.3 | 49.2 |
| Total Cash, percent | .0 | .0 | .0 | .0 | .0 | .0 | .0 | .0 | .0 | .0 |
| Account Receivables | 6.3 | 5.0 | 6.4 | 7.4 | 6.1 | 6.9 | 7.5 | 8.1 | 8.8 | 9.5 |
| Account Receivables, % | 1.42 | 0.86103 | 0.96825 | 1.09 | 1.04 | 1.08 | 1.08 | 1.08 | 1.08 | 1.08 |
| Inventories | 89.3 | 138.9 | 136.0 | 128.9 | 90.4 | 126.5 | 137.2 | 148.9 | 161.6 | 175.4 |
| Inventories, % | 20.12 | 23.84 | 20.56 | 19.08 | 15.34 | 19.79 | 19.79 | 19.79 | 19.79 | 19.79 |
| Accounts Payable | 45.3 | 67.4 | 57.6 | 77.9 | 60.4 | 66.8 | 72.5 | 78.6 | 85.4 | 92.6 |
| Accounts Payable, % | 10.21 | 11.57 | 8.71 | 11.52 | 10.25 | 10.45 | 10.45 | 10.45 | 10.45 | 10.45 |
| Capital Expenditure | -9.8 | -11.6 | -12.6 | -12.0 | -20.6 | -14.5 | -15.8 | -17.1 | -18.5 | -20.1 |
| Capital Expenditure, % | -2.2 | -1.99 | -1.9 | -1.77 | -3.49 | -2.27 | -2.27 | -2.27 | -2.27 | -2.27 |
| Tax Rate, % | -0.66197 | -0.66197 | -0.66197 | -0.66197 | -0.66197 | -0.66197 | -0.66197 | -0.66197 | -0.66197 | -0.66197 |
| EBITAT | .6 | -9.2 | 3.3 | -6.8 | -39.4 | -11.4 | -12.3 | -13.4 | -14.5 | -15.7 |
| Depreciation | ||||||||||
| Changes in Account Receivables | ||||||||||
| Changes in Inventories | ||||||||||
| Changes in Accounts Payable | ||||||||||
| Capital Expenditure | ||||||||||
| UFCF | -51.7 | -36.9 | -3.9 | 24.3 | -18.6 | -41.9 | -18.1 | -19.7 | -21.3 | -23.2 |
| WACC, % | 5.67 | 5.67 | 5.67 | 5.67 | 5.67 | 5.67 | 5.67 | 5.67 | 5.67 | 5.67 |
| PV UFCF | ||||||||||
| SUM PV UFCF | -107.3 | |||||||||
| Long Term Growth Rate, % | 3.50 | |||||||||
| Free cash flow (T + 1) | -24 | |||||||||
| Terminal Value | -1,106 | |||||||||
| Present Terminal Value | -840 | |||||||||
| Enterprise Value | -947 | |||||||||
| Net Debt | 5 | |||||||||
| Equity Value | -952 | |||||||||
| Diluted Shares Outstanding, MM | 57 | |||||||||
| Equity Value Per Share | -16.69 |
What You Will Get
- Editable Forecast Inputs: Easily modify key assumptions (growth %, margins, WACC) to generate various scenarios.
- Real-World Data: CarParts.com, Inc.’s (PRTS) financial data pre-filled to kickstart your analysis.
- Automatic DCF Outputs: The template computes Net Present Value (NPV) and intrinsic value for you.
- Customizable and Professional: A sleek Excel model that adjusts to your valuation requirements.
- Built for Analysts and Investors: Perfect for testing forecasts, validating strategies, and optimizing efficiency.
Key Features
- Comprehensive PRTS Data: Pre-loaded with CarParts.com’s historical performance metrics and future growth estimates.
- Flexible Input Options: Modify sales growth, profit margins, discount rates, tax implications, and capital investments.
- Interactive Valuation Framework: Real-time adjustments to Net Present Value (NPV) and intrinsic value based on your specified variables.
- What-If Analysis: Develop various forecasting scenarios to evaluate different valuation possibilities.
- Intuitive Interface: Clean, organized layout suitable for both industry experts and newcomers.
How It Works
- Step 1: Download the prebuilt Excel template featuring CarParts.com, Inc. (PRTS) data.
- Step 2: Navigate through the pre-filled sheets to familiarize yourself with the key performance indicators.
- Step 3: Modify forecasts and assumptions in the editable yellow cells (WACC, growth, margins).
- Step 4: Instantly see the updated results, including CarParts.com, Inc.'s (PRTS) intrinsic value.
- Step 5: Use the outputs to make well-informed investment decisions or create detailed reports.
Why Choose CarParts.com Calculator?
- Accuracy: Utilizes real CarParts.com financials to ensure reliable data.
- Flexibility: Built for users to easily test and adjust inputs as needed.
- Time-Saving: Avoid the complexities of creating a financial model from the ground up.
- Professional-Grade: Crafted with precision and usability tailored for CFOs.
- User-Friendly: Intuitive design makes it accessible for users without extensive financial modeling expertise.
Who Should Use This Product?
- Auto Repair Professionals: Access comprehensive parts databases to streamline repair processes.
- Fleet Managers: Optimize vehicle maintenance by sourcing quality parts efficiently.
- DIY Enthusiasts: Find the right components for personal vehicle projects and repairs.
- Students and Educators: Utilize real-world automotive data for practical learning in automotive studies.
- Car Enthusiasts: Stay informed about the latest parts and upgrades for personal vehicles.
What the Template Contains
- Pre-Filled Data: Includes CarParts.com’s historical financials and projections.
- Discounted Cash Flow Model: Editable DCF valuation model with automated calculations.
- Weighted Average Cost of Capital (WACC): A dedicated sheet for calculating WACC based on user-defined inputs.
- Key Financial Ratios: Evaluate CarParts.com’s profitability, operational efficiency, and financial leverage.
- Customizable Inputs: Easily modify revenue growth, margins, and tax rates.
- Clear Dashboard: Visual representations and tables summarizing essential valuation outcomes.
Disclaimer
All information, articles, and product details provided on this website are for general informational and educational purposes only. We do not claim any ownership over, nor do we intend to infringe upon, any trademarks, copyrights, logos, brand names, or other intellectual property mentioned or depicted on this site. Such intellectual property remains the property of its respective owners, and any references here are made solely for identification or informational purposes, without implying any affiliation, endorsement, or partnership.
We make no representations or warranties, express or implied, regarding the accuracy, completeness, or suitability of any content or products presented. Nothing on this website should be construed as legal, tax, investment, financial, medical, or other professional advice. In addition, no part of this site—including articles or product references—constitutes a solicitation, recommendation, endorsement, advertisement, or offer to buy or sell any securities, franchises, or other financial instruments, particularly in jurisdictions where such activity would be unlawful.
All content is of a general nature and may not address the specific circumstances of any individual or entity. It is not a substitute for professional advice or services. Any actions you take based on the information provided here are strictly at your own risk. You accept full responsibility for any decisions or outcomes arising from your use of this website and agree to release us from any liability in connection with your use of, or reliance upon, the content or products found herein.