
|
Valoración DCF de Parsons Corporation (PSN) |
Completamente Editable: Adáptelo A Sus Necesidades En Excel O Sheets
Diseño Profesional: Plantillas Confiables Y Estándares De La Industria
Predeterminadas Para Un Uso Rápido Y Eficiente
Compatible con MAC / PC, completamente desbloqueado
No Se Necesita Experiencia; Fáciles De Seguir
Parsons Corporation (PSN) Bundle
¡Descubra el verdadero valor de Parsons Corporation (PSN) con nuestra calculadora DCF avanzada! Ajuste los supuestos esenciales, explore varios escenarios y evalúe cómo los cambios afectan la valoración de Parsons Corporation (PSN), todo dentro de una sola plantilla de Excel.
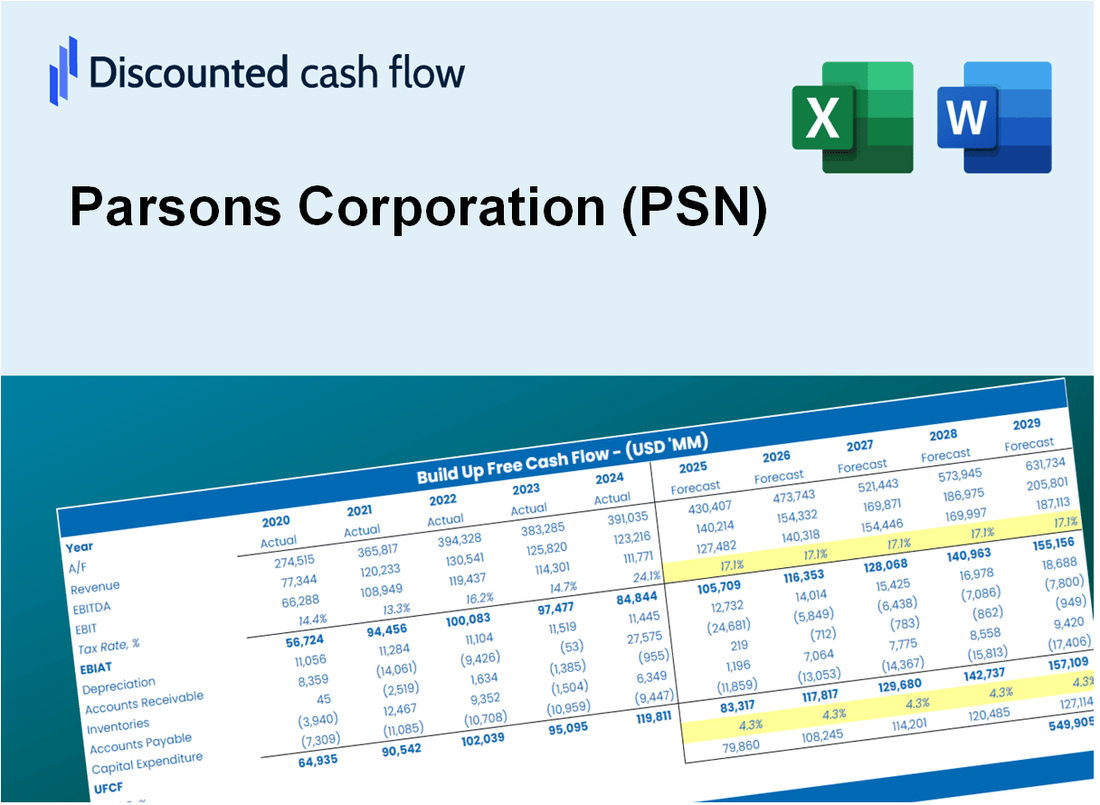
Discounted Cash Flow (DCF) - (USD MM)
| Year | AY1 2020 |
AY2 2021 |
AY3 2022 |
AY4 2023 |
AY5 2024 |
FY1 2025 |
FY2 2026 |
FY3 2027 |
FY4 2028 |
FY5 2029 |
|---|---|---|---|---|---|---|---|---|---|---|
| Revenue | 3,918.9 | 3,660.8 | 4,195.3 | 5,442.7 | 6,750.6 | 7,793.2 | 8,996.7 | 10,386.2 | 11,990.3 | 13,842.1 |
| Revenue Growth, % | 0 | -6.59 | 14.6 | 29.74 | 24.03 | 15.44 | 15.44 | 15.44 | 15.44 | 15.44 |
| EBITDA | 310.3 | 274.5 | 309.9 | 415.5 | 518.5 | 594.1 | 685.9 | 791.8 | 914.1 | 1,055.3 |
| EBITDA, % | 7.92 | 7.5 | 7.39 | 7.63 | 7.68 | 7.62 | 7.62 | 7.62 | 7.62 | 7.62 |
| Depreciation | 128.0 | 144.2 | 120.5 | 120.0 | 99.3 | 214.3 | 247.4 | 285.7 | 329.8 | 380.7 |
| Depreciation, % | 3.27 | 3.94 | 2.87 | 2.2 | 1.47 | 2.75 | 2.75 | 2.75 | 2.75 | 2.75 |
| EBIT | 182.4 | 130.3 | 189.4 | 295.6 | 419.2 | 379.8 | 438.5 | 506.2 | 584.4 | 674.6 |
| EBIT, % | 4.65 | 3.56 | 4.51 | 5.43 | 6.21 | 4.87 | 4.87 | 4.87 | 4.87 | 4.87 |
| Total Cash | 483.6 | 342.6 | 262.5 | 272.9 | 453.5 | 618.6 | 714.2 | 824.5 | 951.8 | 1,098.8 |
| Total Cash, percent | .0 | .0 | .0 | .0 | .0 | .0 | .0 | .0 | .0 | .0 |
| Account Receivables | 1,275.1 | 1,177.5 | 1,351.4 | 1,673.2 | 1,100.4 | 2,243.8 | 2,590.3 | 2,990.4 | 3,452.2 | 3,985.4 |
| Account Receivables, % | 32.54 | 32.17 | 32.21 | 30.74 | 16.3 | 28.79 | 28.79 | 28.79 | 28.79 | 28.79 |
| Inventories | 3.6 | 1.3 | .0 | .0 | .0 | 2.0 | 2.3 | 2.6 | 3.0 | 3.5 |
| Inventories, % | 0.09201454 | 0.03482873 | 0 | 0 | 0 | 0.02536865 | 0.02536865 | 0.02536865 | 0.02536865 | 0.02536865 |
| Accounts Payable | 225.7 | 196.3 | 201.4 | 242.8 | 207.6 | 365.6 | 422.1 | 487.3 | 562.5 | 649.4 |
| Accounts Payable, % | 5.76 | 5.36 | 4.8 | 4.46 | 3.08 | 4.69 | 4.69 | 4.69 | 4.69 | 4.69 |
| Capital Expenditure | -34.0 | -21.1 | -30.6 | -40.4 | -49.2 | -56.8 | -65.6 | -75.7 | -87.4 | -100.9 |
| Capital Expenditure, % | -0.8685 | -0.57652 | -0.72923 | -0.7422 | -0.72902 | -0.72909 | -0.72909 | -0.72909 | -0.72909 | -0.72909 |
| Tax Rate, % | 36.07 | 36.07 | 36.07 | 36.07 | 36.07 | 36.07 | 36.07 | 36.07 | 36.07 | 36.07 |
| EBITAT | 111.3 | 74.1 | 110.1 | 180.4 | 268.0 | 228.7 | 264.0 | 304.8 | 351.9 | 406.2 |
| Depreciation | ||||||||||
| Changes in Account Receivables | ||||||||||
| Changes in Inventories | ||||||||||
| Changes in Accounts Payable | ||||||||||
| Capital Expenditure | ||||||||||
| UFCF | -847.8 | 267.8 | 32.6 | -20.4 | 855.6 | -601.1 | 155.5 | 179.5 | 207.2 | 239.2 |
| WACC, % | 6.13 | 6.11 | 6.12 | 6.13 | 6.15 | 6.13 | 6.13 | 6.13 | 6.13 | 6.13 |
| PV UFCF | ||||||||||
| SUM PV UFCF | 62.9 | |||||||||
| Long Term Growth Rate, % | 3.00 | |||||||||
| Free cash flow (T + 1) | 246 | |||||||||
| Terminal Value | 7,880 | |||||||||
| Present Terminal Value | 5,853 | |||||||||
| Enterprise Value | 5,916 | |||||||||
| Net Debt | 968 | |||||||||
| Equity Value | 4,949 | |||||||||
| Diluted Shares Outstanding, MM | 111 | |||||||||
| Equity Value Per Share | 44.55 |
What You Will Get
- Real Parsons Data: Preloaded financials – from revenue to EBIT – based on actual and projected figures for Parsons Corporation (PSN).
- Full Customization: Adjust all critical parameters (yellow cells) like WACC, growth %, and tax rates specific to Parsons Corporation (PSN).
- Instant Valuation Updates: Automatic recalculations to analyze the impact of changes on Parsons Corporation's (PSN) fair value.
- Versatile Excel Template: Tailored for quick edits, scenario testing, and detailed projections for Parsons Corporation (PSN).
- Time-Saving and Accurate: Skip building models from scratch while maintaining precision and flexibility for Parsons Corporation (PSN).
Key Features
- Customizable Financial Inputs: Adjust essential parameters such as project costs, revenue forecasts, and operational expenses.
- Instant DCF Valuation: Automatically computes intrinsic value, net present value (NPV), and additional financial metrics.
- High-Precision Accuracy: Leverages Parsons Corporation's (PSN) actual financial data for credible valuation results.
- Effortless Scenario Testing: Easily evaluate various assumptions and analyze the resulting impacts.
- Efficiency Booster: Avoid the hassle of creating intricate valuation models from the ground up.
How It Works
- Step 1: Download the Excel file for Parsons Corporation (PSN).
- Step 2: Review Parsons’ pre-filled financial data and forecasts.
- Step 3: Modify key inputs such as revenue growth, WACC, and tax rates (highlighted cells).
- Step 4: Observe the DCF model update in real-time as you adjust your assumptions.
- Step 5: Analyze the outputs and leverage the results for your investment decisions.
Why Choose This Calculator for Parsons Corporation (PSN)?
- Accurate Data: Utilize real financials from Parsons Corporation for dependable valuation outcomes.
- Customizable: Tailor essential variables such as growth rates, WACC, and tax rates to align with your forecasts.
- Time-Saving: Pre-configured calculations save you the hassle of building from the ground up.
- Professional-Grade Tool: Crafted for investors, analysts, and consultants focusing on Parsons Corporation.
- User-Friendly: An intuitive design and clear, step-by-step guidance ensure ease of use for everyone.
Who Should Use This Product?
- Professional Investors: Develop comprehensive and accurate valuation models for portfolio assessment of Parsons Corporation (PSN).
- Corporate Finance Teams: Evaluate valuation scenarios to inform strategic decisions within their organizations.
- Consultants and Advisors: Deliver precise valuation insights to clients regarding Parsons Corporation (PSN) stock.
- Students and Educators: Utilize real-world data to enhance learning and practice in financial modeling.
- Tech Enthusiasts: Gain insights into how companies like Parsons Corporation (PSN) are valued in the marketplace.
What the Template Contains
- Operating and Balance Sheet Data: Pre-filled Parsons Corporation (PSN) historical data and forecasts, including revenue, EBITDA, EBIT, and capital expenditures.
- WACC Calculation: A dedicated sheet for Weighted Average Cost of Capital (WACC), including parameters like Beta, risk-free rate, and share price.
- DCF Valuation (Unlevered and Levered): Editable Discounted Cash Flow models showing intrinsic value with detailed calculations.
- Financial Statements: Pre-loaded financial statements (annual and quarterly) to support analysis.
- Key Ratios: Includes profitability, leverage, and efficiency ratios for Parsons Corporation (PSN).
- Dashboard and Charts: Visual summary of valuation outputs and assumptions to analyze results easily.
Disclaimer
All information, articles, and product details provided on this website are for general informational and educational purposes only. We do not claim any ownership over, nor do we intend to infringe upon, any trademarks, copyrights, logos, brand names, or other intellectual property mentioned or depicted on this site. Such intellectual property remains the property of its respective owners, and any references here are made solely for identification or informational purposes, without implying any affiliation, endorsement, or partnership.
We make no representations or warranties, express or implied, regarding the accuracy, completeness, or suitability of any content or products presented. Nothing on this website should be construed as legal, tax, investment, financial, medical, or other professional advice. In addition, no part of this site—including articles or product references—constitutes a solicitation, recommendation, endorsement, advertisement, or offer to buy or sell any securities, franchises, or other financial instruments, particularly in jurisdictions where such activity would be unlawful.
All content is of a general nature and may not address the specific circumstances of any individual or entity. It is not a substitute for professional advice or services. Any actions you take based on the information provided here are strictly at your own risk. You accept full responsibility for any decisions or outcomes arising from your use of this website and agree to release us from any liability in connection with your use of, or reliance upon, the content or products found herein.