
|
Puravankara Limited (Purva.NS) Valoración de DCF |
Completamente Editable: Adáptelo A Sus Necesidades En Excel O Sheets
Diseño Profesional: Plantillas Confiables Y Estándares De La Industria
Predeterminadas Para Un Uso Rápido Y Eficiente
Compatible con MAC / PC, completamente desbloqueado
No Se Necesita Experiencia; Fáciles De Seguir
Puravankara Limited (PURVA.NS) Bundle
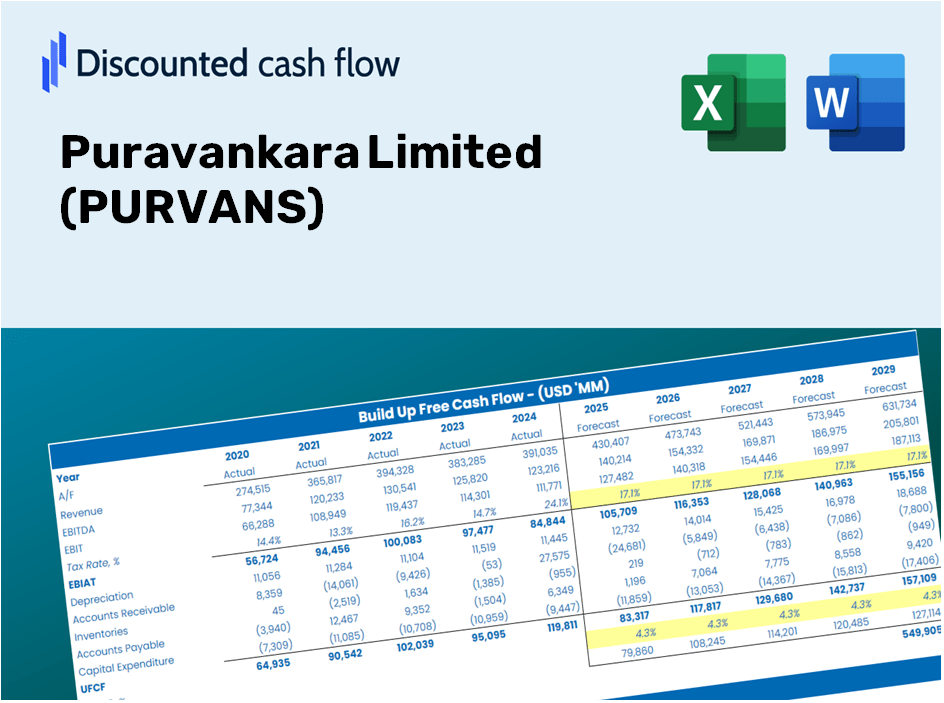
Como inversionista o analista, esta calculadora DCF (Purvans) sirve como su recurso de referencia para una valoración precisa. Precedidos con datos reales de PuraVankara Limited, puede ajustar los pronósticos y observar instantáneamente los resultados.
Benefits You Will Enjoy
- Comprehensive Financial Model: Access to Puravankara Limited’s (PURVANS) actual data for accurate DCF analysis.
- Complete Forecast Customization: Modify key factors such as revenue growth, profit margins, WACC, and more.
- Real-Time Calculations: Instant updates let you view results immediately as you make adjustments.
- Professional-Grade Template: A polished Excel file crafted for top-notch valuation practices.
- Flexible and Repeatable: Designed for adaptability, allowing for repeated use in detailed forecasting.
Key Features
- Advanced DCF Calculator: Features comprehensive unlevered and levered DCF valuation models.
- WACC Calculator: Comes with a pre-configured Weighted Average Cost of Capital sheet, tailored for custom inputs.
- Editable Forecast Assumptions: Easily adjust growth rates, capital expenditures, and discount rates.
- Built-In Financial Ratios: Evaluate profitability, leverage, and efficiency ratios specific to Puravankara Limited (PURVANS).
- Dashboard and Charts: Visual representations that succinctly summarize essential valuation metrics for straightforward analysis.
How It Works
- 1. Access the Template: Download and open the Excel file featuring Puravankara Limited’s (PURVANS) preloaded data.
- 2. Customize Assumptions: Modify essential inputs such as growth rates, WACC, and capital expenditures.
- 3. Analyze Results Immediately: The DCF model automatically computes intrinsic value and NPV.
- 4. Explore Scenarios: Evaluate multiple forecasts to understand various valuation results.
- 5. Present with Assurance: Share expert valuation insights to enhance your decision-making process.
Why Choose This Calculator for Puravankara Limited (PURVANS)?
- Accurate Data: Access real financial metrics from Puravankara Limited for trustworthy valuation outcomes.
- Customizable: Tailor essential inputs such as growth rates, WACC, and tax rates to align with your projections.
- Time-Saving: Built-in calculations mean you can avoid starting from ground zero.
- Professional-Grade Tool: Crafted for the needs of investors, analysts, and consultants.
- User-Friendly: An intuitive design and clear step-by-step guidance make it accessible for everyone.
Who Should Utilize Puravankara Limited (PURVANS)?
- Investors: Assess Puravankara’s valuation prior to making investment decisions.
- CFOs and Financial Analysts: Enhance valuation methodologies and evaluate forecasts.
- Startup Founders: Gain insights into how prominent real estate companies like Puravankara are appraised.
- Consultants: Create detailed valuation reports for clients within the real estate sector.
- Students and Educators: Utilize practical examples to teach and learn valuation strategies.
What the Template Contains
- Historical Data: Includes Puravankara Limited’s past financial performance and baseline forecasts.
- DCF and Levered DCF Models: Comprehensive templates for calculating the intrinsic value of Puravankara Limited (PURVANS).
- WACC Sheet: Pre-configured calculations for Weighted Average Cost of Capital.
- Editable Inputs: Adjust key drivers such as growth rates, EBITDA percentages, and CAPEX assumptions.
- Quarterly and Annual Statements: A thorough breakdown of Puravankara Limited’s financials.
- Interactive Dashboard: Dynamically visualize valuation results and projections.
Disclaimer
All information, articles, and product details provided on this website are for general informational and educational purposes only. We do not claim any ownership over, nor do we intend to infringe upon, any trademarks, copyrights, logos, brand names, or other intellectual property mentioned or depicted on this site. Such intellectual property remains the property of its respective owners, and any references here are made solely for identification or informational purposes, without implying any affiliation, endorsement, or partnership.
We make no representations or warranties, express or implied, regarding the accuracy, completeness, or suitability of any content or products presented. Nothing on this website should be construed as legal, tax, investment, financial, medical, or other professional advice. In addition, no part of this site—including articles or product references—constitutes a solicitation, recommendation, endorsement, advertisement, or offer to buy or sell any securities, franchises, or other financial instruments, particularly in jurisdictions where such activity would be unlawful.
All content is of a general nature and may not address the specific circumstances of any individual or entity. It is not a substitute for professional advice or services. Any actions you take based on the information provided here are strictly at your own risk. You accept full responsibility for any decisions or outcomes arising from your use of this website and agree to release us from any liability in connection with your use of, or reliance upon, the content or products found herein.