
|
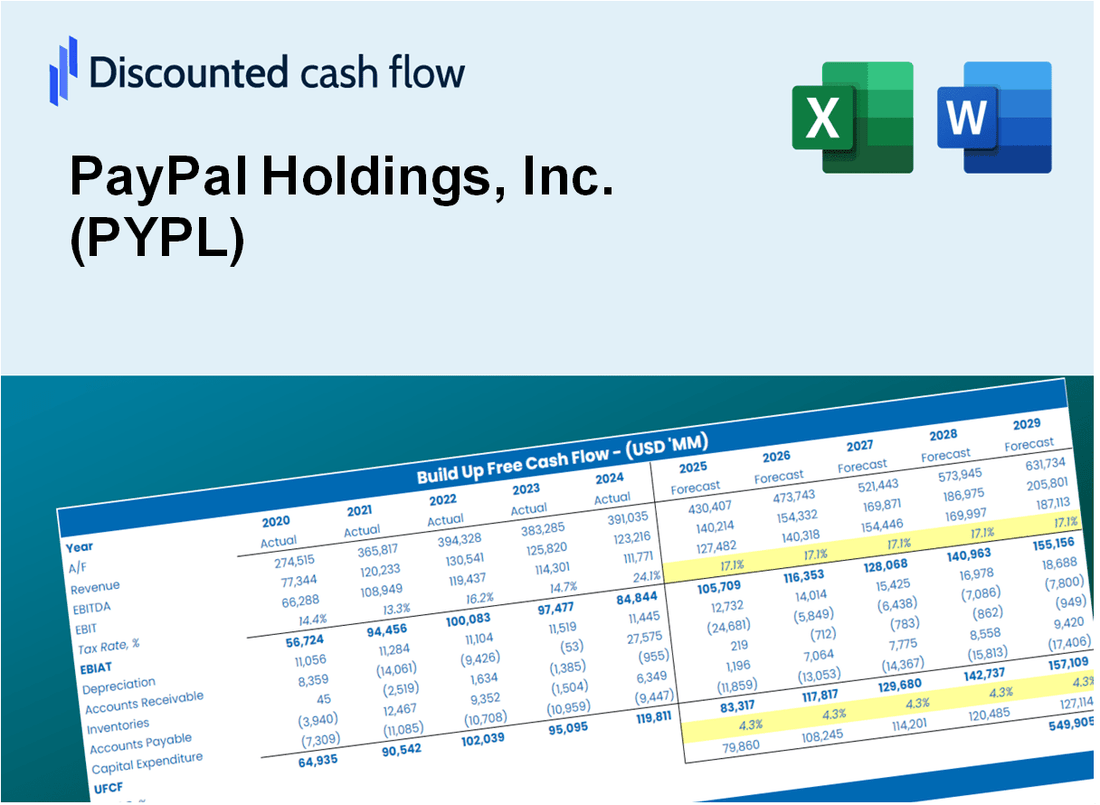
Valoración DCF de PayPal Holdings, Inc. (PYPL) |
Completamente Editable: Adáptelo A Sus Necesidades En Excel O Sheets
Diseño Profesional: Plantillas Confiables Y Estándares De La Industria
Predeterminadas Para Un Uso Rápido Y Eficiente
Compatible con MAC / PC, completamente desbloqueado
No Se Necesita Experiencia; Fáciles De Seguir
PayPal Holdings, Inc. (PYPL) Bundle
¡Evalúe las perspectivas financieras de PayPal Holdings, Inc. (PYPL) como un experto! Esta calculadora DCF (PYPL) proporciona datos financieros preconsados y le permite modificar fácilmente el crecimiento de los ingresos, WACC, los márgenes y otros supuestos críticos para alinearse con sus predicciones.
Discounted Cash Flow (DCF) - (USD MM)
| Year | AY1 2020 |
AY2 2021 |
AY3 2022 |
AY4 2023 |
AY5 2024 |
FY1 2025 |
FY2 2026 |
FY3 2027 |
FY4 2028 |
FY5 2029 |
|---|---|---|---|---|---|---|---|---|---|---|
| Revenue | 21,454.0 | 25,371.0 | 27,518.0 | 29,771.0 | 31,797.0 | 35,112.8 | 38,774.5 | 42,818.0 | 47,283.1 | 52,213.9 |
| Revenue Growth, % | 0 | 18.26 | 8.46 | 8.19 | 6.81 | 10.43 | 10.43 | 10.43 | 10.43 | 10.43 |
| EBITDA | 6,463.0 | 5,596.0 | 4,987.0 | 6,830.0 | 6,743.0 | 8,037.5 | 8,875.7 | 9,801.2 | 10,823.3 | 11,952.0 |
| EBITDA, % | 30.12 | 22.06 | 18.12 | 22.94 | 21.21 | 22.89 | 22.89 | 22.89 | 22.89 | 22.89 |
| Depreciation | 1,189.0 | 1,265.0 | 1,317.0 | 1,072.0 | 1,032.0 | 1,556.2 | 1,718.5 | 1,897.7 | 2,095.6 | 2,314.2 |
| Depreciation, % | 5.54 | 4.99 | 4.79 | 3.6 | 3.25 | 4.43 | 4.43 | 4.43 | 4.43 | 4.43 |
| EBIT | 5,274.0 | 4,331.0 | 3,670.0 | 5,758.0 | 5,711.0 | 6,481.3 | 7,157.1 | 7,903.5 | 8,727.7 | 9,637.8 |
| EBIT, % | 24.58 | 17.07 | 13.34 | 19.34 | 17.96 | 18.46 | 18.46 | 18.46 | 18.46 | 18.46 |
| Total Cash | 13,083.0 | 9,391.0 | 10,851.0 | 14,057.0 | 10,822.0 | 15,357.0 | 16,958.4 | 18,726.9 | 20,679.8 | 22,836.3 |
| Total Cash, percent | .0 | .0 | .0 | .0 | .0 | .0 | .0 | .0 | .0 | .0 |
| Account Receivables | 36,764.0 | 41,787.0 | 44,658.0 | 46,000.0 | 45,618.0 | 35,112.8 | 38,774.5 | 42,818.0 | 47,283.1 | 52,213.9 |
| Account Receivables, % | 171.36 | 164.7 | 162.29 | 154.51 | 143.47 | 100 | 100 | 100 | 100 | 100 |
| Inventories | .0 | .0 | .0 | .0 | .0 | .0 | .0 | .0 | .0 | .0 |
| Inventories, % | 0 | 0 | 0 | 0 | 0 | 0 | 0 | 0 | 0 | 0 |
| Accounts Payable | 35,670.0 | 39,038.0 | 40,140.0 | 42,074.0 | 39,898.0 | 35,112.8 | 38,774.5 | 42,818.0 | 47,283.1 | 52,213.9 |
| Accounts Payable, % | 166.26 | 153.87 | 145.87 | 141.33 | 125.48 | 100 | 100 | 100 | 100 | 100 |
| Capital Expenditure | -866.0 | -908.0 | -706.0 | -623.0 | -683.0 | -1,012.8 | -1,118.4 | -1,235.0 | -1,363.8 | -1,506.0 |
| Capital Expenditure, % | -4.04 | -3.58 | -2.57 | -2.09 | -2.15 | -2.88 | -2.88 | -2.88 | -2.88 | -2.88 |
| Tax Rate, % | 22.18 | 22.18 | 22.18 | 22.18 | 22.18 | 22.18 | 22.18 | 22.18 | 22.18 | 22.18 |
| EBITAT | 4,375.4 | 4,405.0 | 2,637.5 | 4,518.3 | 4,444.3 | 5,329.1 | 5,884.8 | 6,498.5 | 7,176.2 | 7,924.6 |
| Depreciation | ||||||||||
| Changes in Account Receivables | ||||||||||
| Changes in Inventories | ||||||||||
| Changes in Accounts Payable | ||||||||||
| Capital Expenditure | ||||||||||
| UFCF | 3,604.4 | 3,107.0 | 1,479.5 | 5,559.3 | 2,999.3 | 11,592.6 | 6,485.0 | 7,161.2 | 7,908.0 | 8,732.7 |
| WACC, % | 9.52 | 9.61 | 9.47 | 9.5 | 9.5 | 9.52 | 9.52 | 9.52 | 9.52 | 9.52 |
| PV UFCF | ||||||||||
| SUM PV UFCF | 32,481.1 | |||||||||
| Long Term Growth Rate, % | 2.00 | |||||||||
| Free cash flow (T + 1) | 8,907 | |||||||||
| Terminal Value | 118,438 | |||||||||
| Present Terminal Value | 75,164 | |||||||||
| Enterprise Value | 107,645 | |||||||||
| Net Debt | 3,318 | |||||||||
| Equity Value | 104,327 | |||||||||
| Diluted Shares Outstanding, MM | 1,039 | |||||||||
| Equity Value Per Share | 100.41 |
What You Will Get
- Real PYPL Financial Data: Pre-filled with PayPal's historical and projected data for accurate analysis.
- Fully Editable Template: Easily modify key inputs such as revenue growth, WACC, and EBITDA %.
- Automatic Calculations: Watch PayPal's intrinsic value update in real-time based on your adjustments.
- Professional Valuation Tool: Tailored for investors, analysts, and consultants seeking precise DCF results.
- User-Friendly Design: Intuitive layout and clear instructions suitable for all experience levels.
Key Features
- Real-Life PYPL Data: Pre-filled with PayPal’s historical financials and forward-looking projections.
- Fully Customizable Inputs: Adjust revenue growth, margins, WACC, tax rates, and capital expenditures.
- Dynamic Valuation Model: Automatic updates to Net Present Value (NPV) and intrinsic value based on your inputs.
- Scenario Testing: Create multiple forecast scenarios to analyze different valuation outcomes.
- User-Friendly Design: Simple, structured, and designed for professionals and beginners alike.
How It Works
- Download: Obtain the pre-formatted Excel file containing PayPal's financial data.
- Customize: Modify forecasts such as revenue growth, EBITDA %, and WACC to fit your analysis.
- Update Automatically: Watch as the intrinsic value and NPV calculations refresh in real-time.
- Test Scenarios: Develop various projections and instantly compare the results.
- Make Decisions: Leverage the valuation findings to inform your investment approach.
Why Choose This Calculator for PayPal Holdings, Inc. (PYPL)?
- Comprehensive Tool: Combines DCF, WACC, and financial ratio analyses tailored for PayPal.
- Customizable Inputs: Modify yellow-highlighted cells to explore different financial scenarios.
- Detailed Insights: Automatically computes PayPal’s intrinsic value and Net Present Value.
- Preloaded Data: Historical and forecasted data provide reliable starting points for analysis.
- Professional Quality: Perfect for financial analysts, investors, and business consultants focusing on PayPal.
Who Should Use This Product?
- Professional Investors: Develop comprehensive and accurate valuation models for portfolio management.
- Corporate Finance Teams: Evaluate valuation scenarios to inform strategic decisions within the organization.
- Consultants and Advisors: Deliver precise valuation insights for PayPal Holdings, Inc. (PYPL) to clients.
- Students and Educators: Utilize real market data to enhance learning and practice financial modeling techniques.
- Tech Enthusiasts: Gain insights into the market valuation of fintech companies like PayPal Holdings, Inc. (PYPL).
What the Template Contains
- Comprehensive DCF Model: Editable template with detailed valuation calculations specific to PayPal Holdings, Inc. (PYPL).
- Real-World Data: PayPal’s historical and projected financials preloaded for in-depth analysis.
- Customizable Parameters: Adjust WACC, growth rates, and tax assumptions to explore different scenarios.
- Financial Statements: Complete annual and quarterly breakdowns for enhanced insights.
- Key Ratios: Integrated analysis for profitability, efficiency, and leverage metrics.
- Dashboard with Visual Outputs: Charts and tables providing clear, actionable results tailored to PayPal Holdings, Inc. (PYPL).
Disclaimer
All information, articles, and product details provided on this website are for general informational and educational purposes only. We do not claim any ownership over, nor do we intend to infringe upon, any trademarks, copyrights, logos, brand names, or other intellectual property mentioned or depicted on this site. Such intellectual property remains the property of its respective owners, and any references here are made solely for identification or informational purposes, without implying any affiliation, endorsement, or partnership.
We make no representations or warranties, express or implied, regarding the accuracy, completeness, or suitability of any content or products presented. Nothing on this website should be construed as legal, tax, investment, financial, medical, or other professional advice. In addition, no part of this site—including articles or product references—constitutes a solicitation, recommendation, endorsement, advertisement, or offer to buy or sell any securities, franchises, or other financial instruments, particularly in jurisdictions where such activity would be unlawful.
All content is of a general nature and may not address the specific circumstances of any individual or entity. It is not a substitute for professional advice or services. Any actions you take based on the information provided here are strictly at your own risk. You accept full responsibility for any decisions or outcomes arising from your use of this website and agree to release us from any liability in connection with your use of, or reliance upon, the content or products found herein.