
|
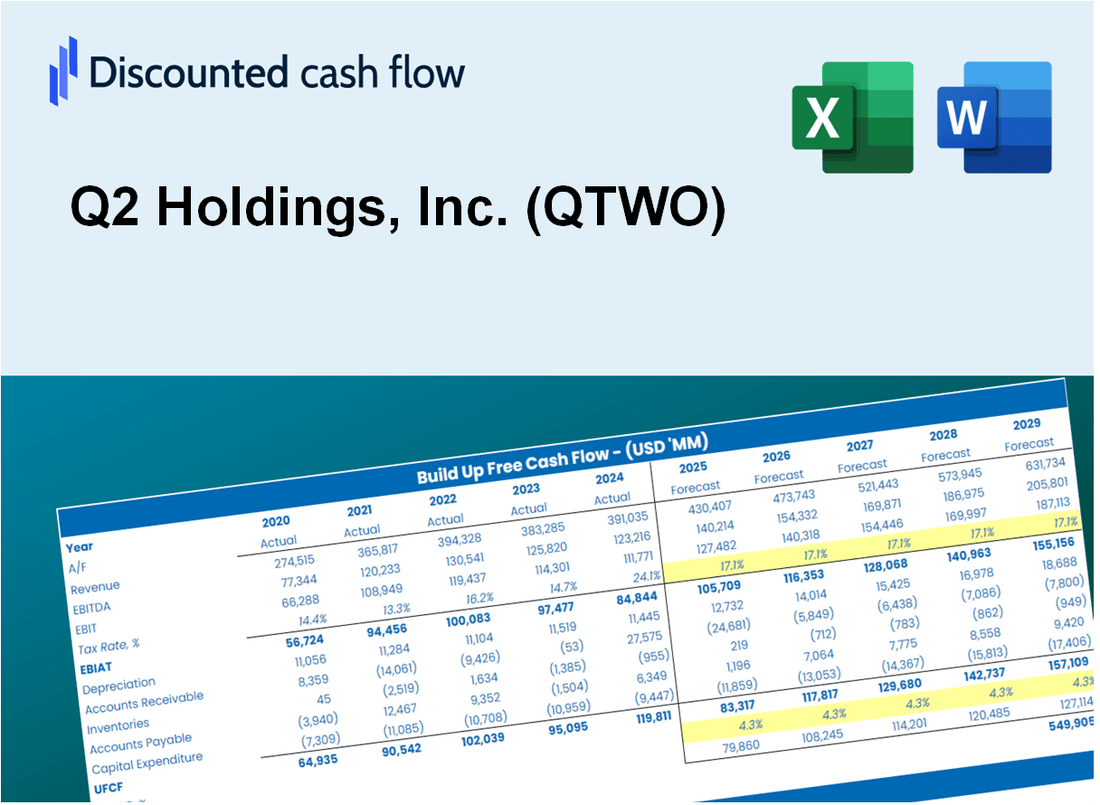
Valoración DCF de Q2 Holdings, Inc. (QTWO) |
Completamente Editable: Adáptelo A Sus Necesidades En Excel O Sheets
Diseño Profesional: Plantillas Confiables Y Estándares De La Industria
Predeterminadas Para Un Uso Rápido Y Eficiente
Compatible con MAC / PC, completamente desbloqueado
No Se Necesita Experiencia; Fáciles De Seguir
Q2 Holdings, Inc. (QTWO) Bundle
¡Tome el control de su análisis de valoración de Q2 Holdings, Inc. (QTWO) con nuestra calculadora DCF avanzada! Precedido con datos reales de QTWO, esta plantilla de Excel le permite ajustar los pronósticos y supuestos para calcular el valor intrínseco de Q2 Holdings, Inc. (QTWO) con precisión.
What You Will Get
- Real QTWO Financial Data: Pre-filled with Q2 Holdings’ historical and projected data for precise analysis.
- Fully Editable Template: Modify key inputs like revenue growth, WACC, and EBITDA % with ease.
- Automatic Calculations: See Q2 Holdings’ intrinsic value update instantly based on your changes.
- Professional Valuation Tool: Designed for investors, analysts, and consultants seeking accurate DCF results.
- User-Friendly Design: Simple structure and clear instructions for all experience levels.
Key Features
- Comprehensive Q2 Financials: Gain access to precise pre-loaded historical data and future forecasts.
- Adjustable Forecast Parameters: Modify highlighted cells for WACC, growth rates, and profit margins.
- Real-Time Calculations: Automatic updates for DCF, Net Present Value (NPV), and cash flow assessments.
- Interactive Dashboard: User-friendly charts and summaries to help visualize your valuation outcomes.
- Suitable for All Levels: An easy-to-navigate layout designed for investors, CFOs, and consultants alike.
How It Works
- 1. Access the Template: Download and open the Excel file containing Q2 Holdings, Inc.'s (QTWO) preloaded financial data.
- 2. Modify Assumptions: Adjust key variables such as growth rates, WACC, and capital expenditures to fit your analysis.
- 3. See Results Immediately: The DCF model automatically computes intrinsic value and NPV based on your inputs.
- 4. Explore Scenarios: Evaluate various forecasts to understand different valuation possibilities.
- 5. Present with Assurance: Share professional valuation findings to bolster your decision-making process.
Why Choose This Calculator for Q2 Holdings, Inc. (QTWO)?
- Accurate Data: Access to real financials for Q2 Holdings ensures reliable valuation outcomes.
- Customizable: Tailor key inputs such as growth rates, WACC, and tax rates to align with your forecasts.
- Time-Saving: Pre-configured calculations save you the hassle of starting from the ground up.
- Professional-Grade Tool: Ideal for investors, analysts, and consultants focusing on Q2 Holdings.
- User-Friendly: Designed with an intuitive interface and step-by-step guidance for all users.
Who Should Use This Product?
- Professional Investors: Develop comprehensive and accurate valuation models for portfolio management focused on Q2 Holdings, Inc. (QTWO).
- Corporate Finance Teams: Evaluate valuation scenarios to inform strategic decisions within their organizations.
- Consultants and Advisors: Deliver precise valuation insights to clients regarding Q2 Holdings, Inc. (QTWO).
- Students and Educators: Utilize real-time data to enhance financial modeling skills in academic settings.
- Tech Enthusiasts: Gain insights into how fintech companies like Q2 Holdings, Inc. (QTWO) are appraised in the market.
What the Template Contains
- Preloaded QTWO Data: Historical and projected financial data, including revenue, EBIT, and capital expenditures.
- DCF and WACC Models: Professional-grade sheets for calculating intrinsic value and Weighted Average Cost of Capital.
- Editable Inputs: Yellow-highlighted cells for adjusting revenue growth, tax rates, and discount rates.
- Financial Statements: Comprehensive annual and quarterly financials for deeper analysis.
- Key Ratios: Profitability, leverage, and efficiency ratios to evaluate performance.
- Dashboard and Charts: Visual summaries of valuation outcomes and assumptions.
Disclaimer
All information, articles, and product details provided on this website are for general informational and educational purposes only. We do not claim any ownership over, nor do we intend to infringe upon, any trademarks, copyrights, logos, brand names, or other intellectual property mentioned or depicted on this site. Such intellectual property remains the property of its respective owners, and any references here are made solely for identification or informational purposes, without implying any affiliation, endorsement, or partnership.
We make no representations or warranties, express or implied, regarding the accuracy, completeness, or suitability of any content or products presented. Nothing on this website should be construed as legal, tax, investment, financial, medical, or other professional advice. In addition, no part of this site—including articles or product references—constitutes a solicitation, recommendation, endorsement, advertisement, or offer to buy or sell any securities, franchises, or other financial instruments, particularly in jurisdictions where such activity would be unlawful.
All content is of a general nature and may not address the specific circumstances of any individual or entity. It is not a substitute for professional advice or services. Any actions you take based on the information provided here are strictly at your own risk. You accept full responsibility for any decisions or outcomes arising from your use of this website and agree to release us from any liability in connection with your use of, or reliance upon, the content or products found herein.