
|
Valoración DCF de Rocky Brands, Inc. (RCKY) |
Completamente Editable: Adáptelo A Sus Necesidades En Excel O Sheets
Diseño Profesional: Plantillas Confiables Y Estándares De La Industria
Predeterminadas Para Un Uso Rápido Y Eficiente
Compatible con MAC / PC, completamente desbloqueado
No Se Necesita Experiencia; Fáciles De Seguir
Rocky Brands, Inc. (RCKY) Bundle
¡Simplifique la valoración de Rocky Brands, Inc. (RCKY) con esta calculadora DCF personalizable! Con Real Rocky Brands, Inc. (RCKY) financieras y entradas de pronóstico ajustables, puede probar escenarios y descubrir el valor razonable de Rocky Brands, Inc. (RCKY) en minutos.
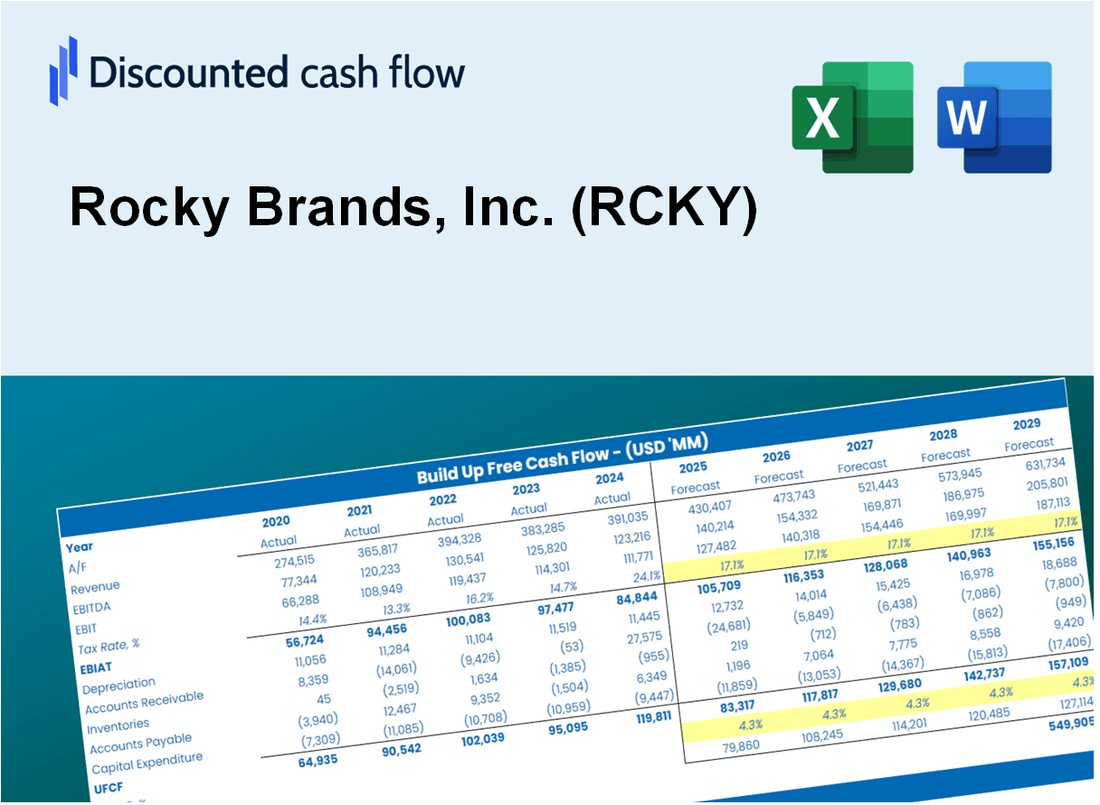
Discounted Cash Flow (DCF) - (USD MM)
| Year | AY1 2020 |
AY2 2021 |
AY3 2022 |
AY4 2023 |
AY5 2024 |
FY1 2025 |
FY2 2026 |
FY3 2027 |
FY4 2028 |
FY5 2029 |
|---|---|---|---|---|---|---|---|---|---|---|
| Revenue | 277.3 | 514.2 | 615.5 | 461.8 | 453.8 | 542.7 | 649.1 | 776.4 | 928.6 | 1,110.6 |
| Revenue Growth, % | 0 | 85.43 | 19.69 | -24.96 | -1.75 | 19.6 | 19.6 | 19.6 | 19.6 | 19.6 |
| EBITDA | 32.4 | 36.7 | 56.4 | 46.3 | 41.3 | 51.1 | 61.2 | 73.2 | 87.5 | 104.7 |
| EBITDA, % | 11.69 | 7.14 | 9.16 | 10.03 | 9.11 | 9.42 | 9.42 | 9.42 | 9.42 | 9.42 |
| Depreciation | 5.2 | 11.3 | 12.3 | 10.9 | 10.3 | 11.6 | 13.9 | 16.7 | 19.9 | 23.8 |
| Depreciation, % | 1.89 | 2.21 | 2 | 2.37 | 2.26 | 2.14 | 2.14 | 2.14 | 2.14 | 2.14 |
| EBIT | 27.2 | 25.4 | 44.0 | 35.4 | 31.1 | 39.5 | 47.2 | 56.5 | 67.6 | 80.8 |
| EBIT, % | 9.8 | 4.93 | 7.16 | 7.66 | 6.85 | 7.28 | 7.28 | 7.28 | 7.28 | 7.28 |
| Total Cash | 28.4 | 5.9 | 5.7 | 4.5 | 3.7 | 15.3 | 18.3 | 21.9 | 26.2 | 31.3 |
| Total Cash, percent | .0 | .0 | .0 | .0 | .0 | .0 | .0 | .0 | .0 | .0 |
| Account Receivables | 53.5 | 132.4 | 95.9 | 81.1 | 73.0 | 102.3 | 122.4 | 146.4 | 175.1 | 209.4 |
| Account Receivables, % | 19.31 | 25.75 | 15.58 | 17.57 | 16.09 | 18.86 | 18.86 | 18.86 | 18.86 | 18.86 |
| Inventories | 77.6 | 232.5 | 235.4 | 169.2 | 166.7 | 200.6 | 239.9 | 287.0 | 343.2 | 410.5 |
| Inventories, % | 27.97 | 45.21 | 38.25 | 36.64 | 36.74 | 36.96 | 36.96 | 36.96 | 36.96 | 36.96 |
| Accounts Payable | 20.1 | 114.6 | 69.7 | 49.8 | 58.1 | 70.0 | 83.7 | 100.1 | 119.7 | 143.2 |
| Accounts Payable, % | 7.24 | 22.29 | 11.32 | 10.79 | 12.8 | 12.89 | 12.89 | 12.89 | 12.89 | 12.89 |
| Capital Expenditure | -11.7 | -21.1 | -6.7 | -3.9 | -4.7 | -12.2 | -14.6 | -17.5 | -21.0 | -25.1 |
| Capital Expenditure, % | -4.22 | -4.09 | -1.09 | -0.84836 | -1.03 | -2.26 | -2.26 | -2.26 | -2.26 | -2.26 |
| Tax Rate, % | 19 | 19 | 19 | 19 | 19 | 19 | 19 | 19 | 19 | 19 |
| EBITAT | 21.1 | 20.6 | 35.0 | 26.1 | 25.2 | 31.0 | 37.1 | 44.4 | 53.1 | 63.5 |
| Depreciation | ||||||||||
| Changes in Account Receivables | ||||||||||
| Changes in Inventories | ||||||||||
| Changes in Accounts Payable | ||||||||||
| Capital Expenditure | ||||||||||
| UFCF | -96.4 | -128.4 | 29.3 | 94.1 | 49.6 | -20.9 | -9.3 | -11.1 | -13.3 | -15.9 |
| WACC, % | 13.19 | 13.34 | 13.27 | 12.99 | 13.34 | 13.23 | 13.23 | 13.23 | 13.23 | 13.23 |
| PV UFCF | ||||||||||
| SUM PV UFCF | -50.0 | |||||||||
| Long Term Growth Rate, % | 3.50 | |||||||||
| Free cash flow (T + 1) | -16 | |||||||||
| Terminal Value | -169 | |||||||||
| Present Terminal Value | -91 | |||||||||
| Enterprise Value | -141 | |||||||||
| Net Debt | 131 | |||||||||
| Equity Value | -272 | |||||||||
| Diluted Shares Outstanding, MM | 7 | |||||||||
| Equity Value Per Share | -36.38 |
What You Will Get
- Real RCKY Financial Data: Pre-filled with Rocky Brands’ historical and projected data for precise analysis.
- Fully Editable Template: Modify key inputs like revenue growth, WACC, and EBITDA % with ease.
- Automatic Calculations: See Rocky Brands’ intrinsic value update instantly based on your changes.
- Professional Valuation Tool: Designed for investors, analysts, and consultants seeking accurate DCF results.
- User-Friendly Design: Simple structure and clear instructions for all experience levels.
Key Features
- Real-Life RCKY Data: Pre-filled with Rocky Brands’ historical financials and future projections.
- Fully Customizable Inputs: Adjust revenue growth, profit margins, WACC, tax rates, and capital expenditures as needed.
- Dynamic Valuation Model: Automatic updates to Net Present Value (NPV) and intrinsic value based on your customized inputs.
- Scenario Testing: Develop multiple forecast scenarios to explore various valuation outcomes.
- User-Friendly Design: Intuitive, organized, and suitable for both professionals and newcomers.
How It Works
- 1. Access the Template: Download and open the Excel file featuring Rocky Brands, Inc. (RCKY) preloaded data.
- 2. Modify Assumptions: Adjust essential inputs such as growth rates, WACC, and capital expenditures.
- 3. Instant Results: The DCF model automatically calculates intrinsic value and NPV in real-time.
- 4. Explore Scenarios: Evaluate various forecasts to examine different valuation results.
- 5. Present with Assurance: Deliver professional valuation insights to back your strategic decisions.
Why Choose This Calculator for Rocky Brands, Inc. (RCKY)?
- Accuracy: Utilizes real Rocky Brands financial data to ensure precision.
- Flexibility: Tailored for users to easily adjust and experiment with inputs.
- Time-Saving: Avoid the complexities of constructing a DCF model from the ground up.
- Professional-Grade: Crafted with the expertise and usability expected at the CFO level.
- User-Friendly: Intuitive design makes it accessible for those without extensive financial modeling skills.
Who Should Use This Product?
- Individual Investors: Make informed decisions about buying or selling Rocky Brands, Inc. (RCKY) stock.
- Financial Analysts: Streamline valuation processes with ready-to-use financial models for Rocky Brands, Inc. (RCKY).
- Consultants: Deliver professional valuation insights on Rocky Brands, Inc. (RCKY) to clients quickly and accurately.
- Business Owners: Understand how companies like Rocky Brands, Inc. (RCKY) are valued to guide your own strategy.
- Finance Students: Learn valuation techniques using real-world data and scenarios related to Rocky Brands, Inc. (RCKY).
What the Template Contains
- Operating and Balance Sheet Data: Pre-filled Rocky Brands, Inc. (RCKY) historical data and forecasts, including revenue, EBITDA, EBIT, and capital expenditures.
- WACC Calculation: A dedicated sheet for Weighted Average Cost of Capital (WACC), including parameters like Beta, risk-free rate, and share price.
- DCF Valuation (Unlevered and Levered): Editable Discounted Cash Flow models showing intrinsic value with detailed calculations.
- Financial Statements: Pre-loaded financial statements (annual and quarterly) to support analysis.
- Key Ratios: Includes profitability, leverage, and efficiency ratios for Rocky Brands, Inc. (RCKY).
- Dashboard and Charts: Visual summary of valuation outputs and assumptions to analyze results easily.
Disclaimer
All information, articles, and product details provided on this website are for general informational and educational purposes only. We do not claim any ownership over, nor do we intend to infringe upon, any trademarks, copyrights, logos, brand names, or other intellectual property mentioned or depicted on this site. Such intellectual property remains the property of its respective owners, and any references here are made solely for identification or informational purposes, without implying any affiliation, endorsement, or partnership.
We make no representations or warranties, express or implied, regarding the accuracy, completeness, or suitability of any content or products presented. Nothing on this website should be construed as legal, tax, investment, financial, medical, or other professional advice. In addition, no part of this site—including articles or product references—constitutes a solicitation, recommendation, endorsement, advertisement, or offer to buy or sell any securities, franchises, or other financial instruments, particularly in jurisdictions where such activity would be unlawful.
All content is of a general nature and may not address the specific circumstances of any individual or entity. It is not a substitute for professional advice or services. Any actions you take based on the information provided here are strictly at your own risk. You accept full responsibility for any decisions or outcomes arising from your use of this website and agree to release us from any liability in connection with your use of, or reliance upon, the content or products found herein.