
|
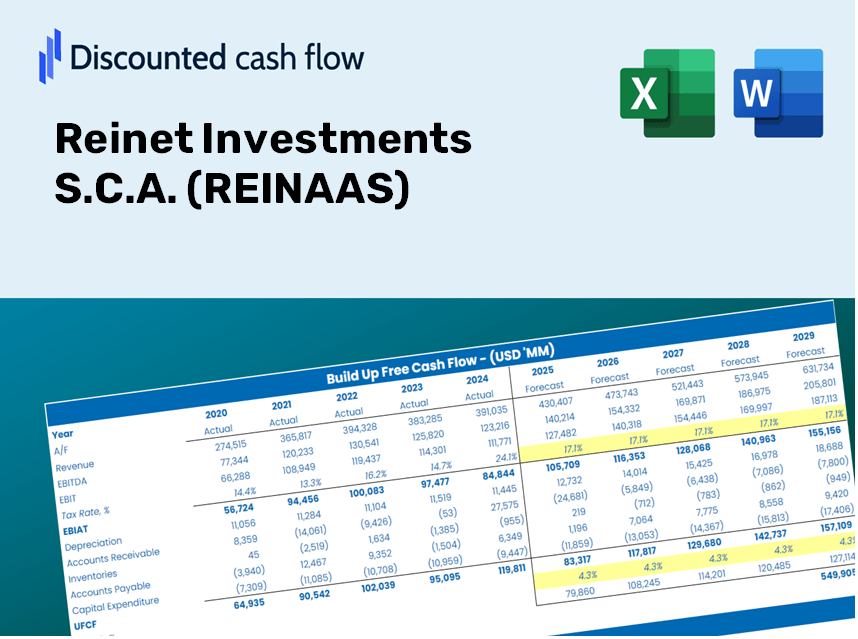
Reinet Investments S.C.A. (Reina.as) Valoración de DCF |
Completamente Editable: Adáptelo A Sus Necesidades En Excel O Sheets
Diseño Profesional: Plantillas Confiables Y Estándares De La Industria
Predeterminadas Para Un Uso Rápido Y Eficiente
Compatible con MAC / PC, completamente desbloqueado
No Se Necesita Experiencia; Fáciles De Seguir
Reinet Investments S.C.A. (REINA.AS) Bundle
Diseñada para la precisión, nuestra calculadora DCF (Reinaas) le permite evaluar Reinet Investments S.C.A. Valoración utilizando datos financieros actualizados y proporciona flexibilidad completa para modificar todos los parámetros esenciales para pronósticos mejorados.
Discounted Cash Flow (DCF) - (USD MM)
| Year | AY1 2021 |
AY2 2022 |
AY3 2023 |
AY4 2024 |
AY5 2025 |
FY1 2026 |
FY2 2027 |
FY3 2028 |
FY4 2029 |
FY5 2030 |
|---|---|---|---|---|---|---|---|---|---|---|
| Revenue | 1,018.0 | 604.0 | -116.0 | 522.0 | 820.0 | 443.7 | 240.0 | 129.9 | 70.3 | 38.0 |
| Revenue Growth, % | 0 | -40.67 | -119.21 | -550 | 57.09 | -45.89 | -45.89 | -45.89 | -45.89 | -45.89 |
| EBITDA | .0 | .0 | .0 | .0 | 797.0 | 86.2 | 46.7 | 25.2 | 13.7 | 7.4 |
| EBITDA, % | 0 | 0 | 0 | 0 | 97.2 | 19.44 | 19.44 | 19.44 | 19.44 | 19.44 |
| Depreciation | -1,016.0 | -602.0 | 120.0 | -519.0 | -795.0 | -440.0 | -238.1 | -128.8 | -69.7 | -37.7 |
| Depreciation, % | -99.8 | -99.67 | -103.45 | -99.43 | -96.95 | -99.17 | -99.17 | -99.17 | -99.17 | -99.17 |
| EBIT | 1,016.0 | 602.0 | -120.0 | 519.0 | 1,592.0 | 442.7 | 239.5 | 129.6 | 70.1 | 37.9 |
| EBIT, % | 99.8 | 99.67 | 103.45 | 99.43 | 194.15 | 99.78 | 99.78 | 99.78 | 99.78 | 99.78 |
| Total Cash | 1.0 | 7.0 | .0 | .0 | .0 | 1.1 | .6 | .3 | .2 | .1 |
| Total Cash, percent | .0 | .0 | .0 | .0 | .0 | .0 | .0 | .0 | .0 | .0 |
| Account Receivables | .0 | .0 | .0 | .0 | .0 | .0 | .0 | .0 | .0 | .0 |
| Account Receivables, % | 0 | 0 | 0 | 0 | 0 | 0 | 0 | 0 | 0 | 0 |
| Inventories | .0 | .0 | .0 | .0 | .0 | .0 | .0 | .0 | .0 | .0 |
| Inventories, % | 0 | 0 | 0 | 0 | 0 | 0 | 0 | 0 | 0 | 0 |
| Accounts Payable | 2.0 | .0 | .0 | .0 | .0 | .2 | .1 | .1 | .0 | .0 |
| Accounts Payable, % | 0.19646 | 0 | 0 | 0 | 0 | 0.03929273 | 0.03929273 | 0.03929273 | 0.03929273 | 0.03929273 |
| Capital Expenditure | .0 | .0 | .0 | .0 | .0 | .0 | .0 | .0 | .0 | .0 |
| Capital Expenditure, % | 0 | 0 | 0 | 0 | 0 | 0 | 0 | 0 | 0 | 0 |
| Tax Rate, % | 0.25094 | 0.25094 | 0.25094 | 0.25094 | 0.25094 | 0.25094 | 0.25094 | 0.25094 | 0.25094 | 0.25094 |
| EBITAT | 1,016.0 | 602.0 | -120.0 | 519.0 | 1,588.0 | 442.5 | 239.4 | 129.5 | 70.1 | 37.9 |
| Depreciation | ||||||||||
| Changes in Account Receivables | ||||||||||
| Changes in Inventories | ||||||||||
| Changes in Accounts Payable | ||||||||||
| Capital Expenditure | ||||||||||
| UFCF | 2.0 | -2.0 | .0 | .0 | 793.0 | 2.7 | 1.3 | .7 | .4 | .2 |
| WACC, % | 6.18 | 6.18 | 6.18 | 6.18 | 6.18 | 6.18 | 6.18 | 6.18 | 6.18 | 6.18 |
| PV UFCF | ||||||||||
| SUM PV UFCF | 4.6 | |||||||||
| Long Term Growth Rate, % | 2.00 | |||||||||
| Free cash flow (T + 1) | 0 | |||||||||
| Terminal Value | 5 | |||||||||
| Present Terminal Value | 4 | |||||||||
| Enterprise Value | 8 | |||||||||
| Net Debt | 0 | |||||||||
| Equity Value | 8 | |||||||||
| Diluted Shares Outstanding, MM | 182 | |||||||||
| Equity Value Per Share | 0.05 |
What You'll Receive
- Authentic REINAAS Financials: Access both historical and projected data for precise valuation assessments.
- Customizable Inputs: Adjust WACC, tax rates, revenue growth, and capital expenditure figures as needed.
- Dynamic Calculations: Intrinsic value and NPV calculations are performed automatically.
- Scenario Analysis: Evaluate various scenarios to analyze the future potential of Reinet Investments.
- User-Friendly Design: Tailored for professionals while remaining approachable for newcomers.
Core Characteristics
- Genuine Reinet Financials: Gain access to precise historical data and future forecasts tailored for Reinet Investments S.C.A. (REINAAS).
- Adjustable Forecast Parameters: Modify highlighted cells for key variables such as WACC, growth rates, and profit margins.
- Real-Time Calculations: Instant updates for DCF, Net Present Value (NPV), and cash flow assessments.
- Interactive Dashboard: User-friendly charts and summaries to effectively display your valuation findings.
- Designed for All Experience Levels: An accessible, intuitive format suitable for investors, CFOs, and consultants alike.
How It Works
- Step 1: Download the prebuilt Excel template containing Reinet Investments S.C.A. (REINAAS) data.
- Step 2: Review the pre-filled sheets to familiarize yourself with the essential metrics.
- Step 3: Modify forecasts and assumptions in the editable yellow cells (WACC, growth, margins).
- Step 4: Instantly see recalculated results, including the intrinsic value of Reinet Investments S.C.A. (REINAAS).
- Step 5: Use the outputs to make informed investment choices or create detailed reports.
Why Choose This Calculator for Reinet Investments S.C.A. (REINAAS)?
- User-Friendly Interface: Suitable for both novices and seasoned professionals.
- Customizable Parameters: Effortlessly adjust inputs to tailor your analysis.
- Real-Time Feedback: Witness immediate updates to Reinet's valuation as you modify the variables.
- Preconfigured Data: Comes with Reinet's actual financial information for swift evaluations.
- Relied Upon by Experts: Utilized by investors and analysts to make well-informed choices.
Who Should Utilize This Product?
- Institutional Investors: Create comprehensive and dependable valuation models for investment analysis of Reinet Investments S.C.A. (REINAAS).
- Corporate Finance Teams: Evaluate various valuation scenarios to inform strategic decisions within their organizations.
- Financial Consultants and Advisors: Deliver precise valuation insights for clients interested in Reinet Investments S.C.A. (REINAAS).
- Students and Educators: Utilize real-time data to enhance learning experiences in financial modeling and investment analysis.
- Investment Enthusiasts: Gain insights into how companies like Reinet Investments S.C.A. (REINAAS) are valued within the market.
What the Template Contains
- Pre-Filled DCF Model: Reinet Investments S.C.A. ([REINAAS]) financial data preloaded for immediate use.
- WACC Calculator: Comprehensive calculations for Weighted Average Cost of Capital.
- Financial Ratios: Assess Reinet’s profitability, leverage, and efficiency metrics.
- Editable Inputs: Modify assumptions such as growth rates, profit margins, and CAPEX to match your scenarios.
- Financial Statements: Annual and quarterly reports to facilitate in-depth analysis.
- Interactive Dashboard: Effortlessly visualize essential valuation metrics and outcomes.
Disclaimer
All information, articles, and product details provided on this website are for general informational and educational purposes only. We do not claim any ownership over, nor do we intend to infringe upon, any trademarks, copyrights, logos, brand names, or other intellectual property mentioned or depicted on this site. Such intellectual property remains the property of its respective owners, and any references here are made solely for identification or informational purposes, without implying any affiliation, endorsement, or partnership.
We make no representations or warranties, express or implied, regarding the accuracy, completeness, or suitability of any content or products presented. Nothing on this website should be construed as legal, tax, investment, financial, medical, or other professional advice. In addition, no part of this site—including articles or product references—constitutes a solicitation, recommendation, endorsement, advertisement, or offer to buy or sell any securities, franchises, or other financial instruments, particularly in jurisdictions where such activity would be unlawful.
All content is of a general nature and may not address the specific circumstances of any individual or entity. It is not a substitute for professional advice or services. Any actions you take based on the information provided here are strictly at your own risk. You accept full responsibility for any decisions or outcomes arising from your use of this website and agree to release us from any liability in connection with your use of, or reliance upon, the content or products found herein.