
|
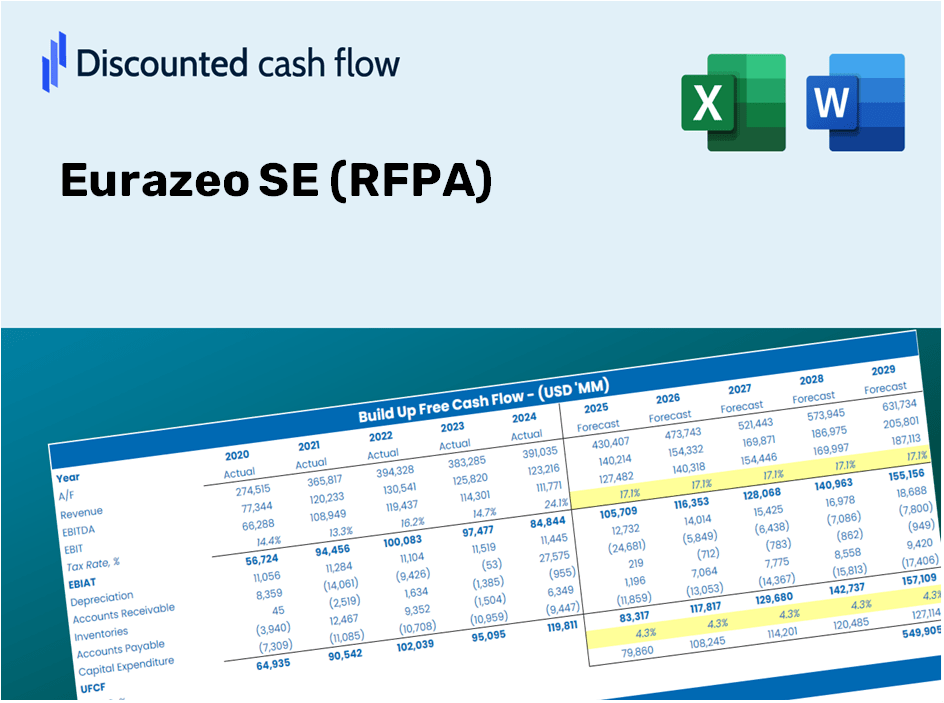
Eurazeo SE (RF.PA) DCF Valoración |
Completamente Editable: Adáptelo A Sus Necesidades En Excel O Sheets
Diseño Profesional: Plantillas Confiables Y Estándares De La Industria
Predeterminadas Para Un Uso Rápido Y Eficiente
Compatible con MAC / PC, completamente desbloqueado
No Se Necesita Experiencia; Fáciles De Seguir
Eurazeo SE (RF.PA) Bundle
¡Descubre el valor real de Eurazeo SE (RFPA) con nuestra calculadora DCF avanzada! Ajuste los supuestos críticos, explore varios escenarios y evalúe cómo los diferentes factores afectan la valoración de Eurazeo SE (RFPA), todo dentro de una plantilla de Excel conveniente.
Discounted Cash Flow (DCF) - (USD MM)
| Year | AY1 2020 |
AY2 2021 |
AY3 2022 |
AY4 2023 |
AY5 2024 |
FY1 2025 |
FY2 2026 |
FY3 2027 |
FY4 2028 |
FY5 2029 |
|---|---|---|---|---|---|---|---|---|---|---|
| Revenue | 3,968.6 | 6,149.2 | 5,589.0 | 405.0 | 380.8 | 330.5 | 286.8 | 248.9 | 216.0 | 187.5 |
| Revenue Growth, % | 0 | 54.95 | -9.11 | -92.75 | -5.95 | -13.22 | -13.22 | -13.22 | -13.22 | -13.22 |
| EBITDA | 886.5 | 2,815.7 | 1,396.8 | 1,942.8 | -327.0 | 70.9 | 61.5 | 53.4 | 46.3 | 40.2 |
| EBITDA, % | 22.34 | 45.79 | 24.99 | 479.77 | -85.87 | 21.45 | 21.45 | 21.45 | 21.45 | 21.45 |
| Depreciation | 472.7 | 491.7 | 482.1 | 22.1 | 22.6 | 26.4 | 22.9 | 19.9 | 17.2 | 15.0 |
| Depreciation, % | 11.91 | 8 | 8.63 | 5.45 | 5.94 | 7.98 | 7.98 | 7.98 | 7.98 | 7.98 |
| EBIT | 413.8 | 2,324.0 | 914.6 | 1,920.7 | -349.7 | 48.1 | 41.7 | 36.2 | 31.4 | 27.3 |
| EBIT, % | 10.43 | 37.79 | 16.36 | 474.32 | -91.81 | 14.56 | 14.56 | 14.56 | 14.56 | 14.56 |
| Total Cash | 1,304.0 | 1,778.4 | 1,085.0 | 152.0 | 123.8 | 100.0 | 86.7 | 75.3 | 65.3 | 56.7 |
| Total Cash, percent | .0 | .0 | .0 | .0 | .0 | .0 | .0 | .0 | .0 | .0 |
| Account Receivables | 785.1 | 847.2 | 693.7 | 274.6 | 253.3 | 119.2 | 103.4 | 89.8 | 77.9 | 67.6 |
| Account Receivables, % | 19.78 | 13.78 | 12.41 | 67.81 | 66.51 | 36.06 | 36.06 | 36.06 | 36.06 | 36.06 |
| Inventories | 483.1 | 393.6 | 492.5 | -34.7 | .0 | 12.4 | 10.8 | 9.4 | 8.1 | 7.1 |
| Inventories, % | 12.17 | 6.4 | 8.81 | -8.56 | 0 | 3.76 | 3.76 | 3.76 | 3.76 | 3.76 |
| Accounts Payable | 863.4 | 796.2 | 763.6 | 71.6 | 85.5 | 58.5 | 50.8 | 44.1 | 38.2 | 33.2 |
| Accounts Payable, % | 21.76 | 12.95 | 13.66 | 17.68 | 22.46 | 17.7 | 17.7 | 17.7 | 17.7 | 17.7 |
| Capital Expenditure | -232.7 | -259.8 | -444.7 | -.7 | -15.4 | -14.7 | -12.8 | -11.1 | -9.6 | -8.3 |
| Capital Expenditure, % | -5.86 | -4.22 | -7.96 | -0.16298 | -4.05 | -4.45 | -4.45 | -4.45 | -4.45 | -4.45 |
| Tax Rate, % | -3.33 | -3.33 | -3.33 | -3.33 | -3.33 | -3.33 | -3.33 | -3.33 | -3.33 | -3.33 |
| EBITAT | 246.6 | 1,860.4 | 949.5 | 1,886.2 | -361.3 | 42.1 | 36.6 | 31.7 | 27.5 | 23.9 |
| Depreciation | ||||||||||
| Changes in Account Receivables | ||||||||||
| Changes in Inventories | ||||||||||
| Changes in Accounts Payable | ||||||||||
| Capital Expenditure | ||||||||||
| UFCF | 81.8 | 2,052.4 | 1,009.1 | 2,161.9 | -353.6 | 148.5 | 56.4 | 48.9 | 42.4 | 36.8 |
| WACC, % | 7.63 | 7.93 | 8.22 | 8.19 | 8.22 | 8.04 | 8.04 | 8.04 | 8.04 | 8.04 |
| PV UFCF | ||||||||||
| SUM PV UFCF | 280.7 | |||||||||
| Long Term Growth Rate, % | 2.00 | |||||||||
| Free cash flow (T + 1) | 38 | |||||||||
| Terminal Value | 622 | |||||||||
| Present Terminal Value | 423 | |||||||||
| Enterprise Value | 704 | |||||||||
| Net Debt | 1,343 | |||||||||
| Equity Value | -640 | |||||||||
| Diluted Shares Outstanding, MM | 72 | |||||||||
| Equity Value Per Share | -8.85 |
What You Will Receive
- Authentic RFPA Financial Data: Pre-loaded with Eurazeo SE’s historical and projected figures for detailed analysis.
- Completely Customizable Template: Effortlessly adjust essential inputs such as revenue growth, WACC, and EBITDA %.
- Instant Calculations: Watch the intrinsic value of Eurazeo SE update in real-time as you make modifications.
- Professional Valuation Tool: Tailored for investors, analysts, and consultants aiming for precise DCF metrics.
- User-Friendly Interface: Clear layout and straightforward instructions suitable for all skill levels.
Key Features
- Accurate Financial Data for Eurazeo SE (RFPA): Gain access to reliable historical data and future forecasts.
- Editable Forecast Parameters: Customize key inputs such as WACC, growth rates, and margins in highlighted cells.
- Real-Time Calculations: Enjoy automatic updates to your DCF, Net Present Value (NPV), and cash flow analyses.
- User-Friendly Dashboard: Benefit from clear charts and summaries to help visualize your valuation findings.
- Designed for Everyone: An intuitive layout tailored for investors, CFOs, and consultants alike.
How It Functions
- Download: Obtain the preformatted Excel file containing Eurazeo SE's (RFPA) financial data.
- Customize: Tailor your forecasts, including revenue growth rates, EBITDA percentages, and WACC.
- Update Automatically: Watch as the intrinsic value and NPV calculations refresh in real-time.
- Test Scenarios: Generate multiple projections and evaluate the results instantly.
- Make Decisions: Leverage the valuation insights to shape your investment strategy.
Why Opt for This Calculator?
- All-in-One Solution: Features DCF, WACC, and financial ratio analyses seamlessly integrated.
- Flexible Inputs: Modify yellow-highlighted fields to explore different scenarios.
- In-Depth Analysis: Automatically computes Eurazeo SE’s intrinsic value and Net Present Value.
- Data Ready: Comes with historical and projected data for precise calculations.
- Professional Standard: Perfect for financial analysts, investors, and business consultants.
Who Should Utilize This Product?
- Investors: Precisely assess the fair value of Eurazeo SE (RFPA) before making investment choices.
- CFOs: Utilize a high-quality DCF model for financial reporting and analysis pertaining to Eurazeo SE (RFPA).
- Consultants: Efficiently modify the template for valuation reports tailored for clients interested in Eurazeo SE (RFPA).
- Entrepreneurs: Acquire valuable insights into financial modeling practices employed by leading firms.
- Educators: Implement it as a instructional resource to illustrate valuation techniques related to Eurazeo SE (RFPA).
Contents of the Template
- Operating and Balance Sheet Data: Pre-filled historical data and forecasts for Eurazeo SE (RFPA), including revenue, EBITDA, EBIT, and capital expenditures.
- WACC Calculation: A dedicated sheet for the Weighted Average Cost of Capital (WACC), featuring parameters such as Beta, risk-free rate, and stock price.
- DCF Valuation (Unlevered and Levered): Customizable Discounted Cash Flow models that display intrinsic value with comprehensive calculations.
- Financial Statements: Pre-loaded annual and quarterly financial statements to facilitate analysis.
- Key Ratios: A collection of profitability, leverage, and efficiency ratios for Eurazeo SE (RFPA).
- Dashboard and Charts: Visual representation of valuation outputs and assumptions for easy analysis of results.
Disclaimer
All information, articles, and product details provided on this website are for general informational and educational purposes only. We do not claim any ownership over, nor do we intend to infringe upon, any trademarks, copyrights, logos, brand names, or other intellectual property mentioned or depicted on this site. Such intellectual property remains the property of its respective owners, and any references here are made solely for identification or informational purposes, without implying any affiliation, endorsement, or partnership.
We make no representations or warranties, express or implied, regarding the accuracy, completeness, or suitability of any content or products presented. Nothing on this website should be construed as legal, tax, investment, financial, medical, or other professional advice. In addition, no part of this site—including articles or product references—constitutes a solicitation, recommendation, endorsement, advertisement, or offer to buy or sell any securities, franchises, or other financial instruments, particularly in jurisdictions where such activity would be unlawful.
All content is of a general nature and may not address the specific circumstances of any individual or entity. It is not a substitute for professional advice or services. Any actions you take based on the information provided here are strictly at your own risk. You accept full responsibility for any decisions or outcomes arising from your use of this website and agree to release us from any liability in connection with your use of, or reliance upon, the content or products found herein.