
|
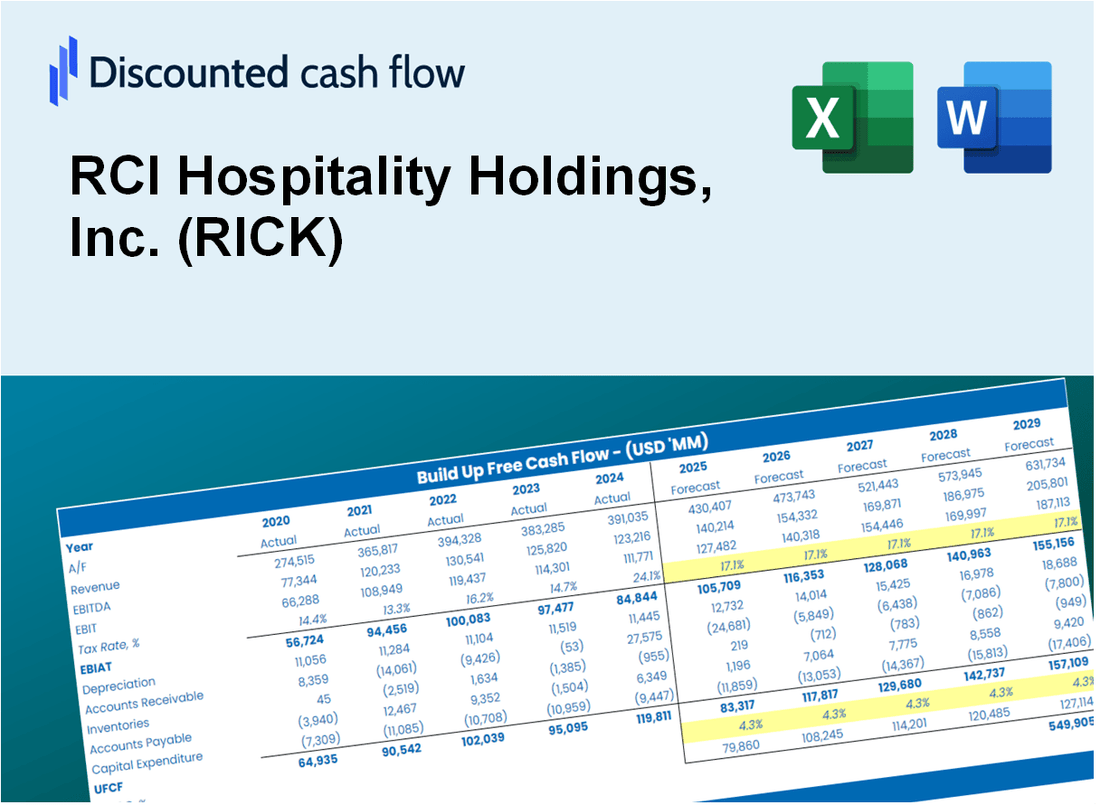
Valoración DCF de RCI Hospitality Holdings, Inc. (RICK) |
Completamente Editable: Adáptelo A Sus Necesidades En Excel O Sheets
Diseño Profesional: Plantillas Confiables Y Estándares De La Industria
Predeterminadas Para Un Uso Rápido Y Eficiente
Compatible con MAC / PC, completamente desbloqueado
No Se Necesita Experiencia; Fáciles De Seguir
RCI Hospitality Holdings, Inc. (RICK) Bundle
¡Evalúe las perspectivas financieras de RCI Hospitality Holdings, Inc. como un experto experimentado! Esta calculadora DCF (RICK) le proporciona datos financieros precipitados y la flexibilidad para modificar el crecimiento de los ingresos, WACC, los márgenes y otros supuestos esenciales para alinearse con sus proyecciones.
Discounted Cash Flow (DCF) - (USD MM)
| Year | AY1 2020 |
AY2 2021 |
AY3 2022 |
AY4 2023 |
AY5 2024 |
FY1 2025 |
FY2 2026 |
FY3 2027 |
FY4 2028 |
FY5 2029 |
|---|---|---|---|---|---|---|---|---|---|---|
| Revenue | 132.3 | 195.3 | 267.6 | 293.8 | 295.6 | 365.8 | 452.7 | 560.2 | 693.3 | 858.0 |
| Revenue Growth, % | 0 | 47.56 | 37.06 | 9.78 | 0.61745 | 23.75 | 23.75 | 23.75 | 23.75 | 23.75 |
| EBITDA | 22.1 | 60.1 | 84.6 | 67.0 | 34.7 | 83.2 | 102.9 | 127.4 | 157.6 | 195.1 |
| EBITDA, % | 16.72 | 30.8 | 31.61 | 22.81 | 11.73 | 22.74 | 22.74 | 22.74 | 22.74 | 22.74 |
| Depreciation | 10.5 | 10.0 | 15.0 | 15.2 | 15.4 | 21.2 | 26.3 | 32.5 | 40.2 | 49.8 |
| Depreciation, % | 7.93 | 5.1 | 5.6 | 5.16 | 5.21 | 5.8 | 5.8 | 5.8 | 5.8 | 5.8 |
| EBIT | 11.6 | 50.2 | 69.6 | 51.9 | 19.3 | 62.0 | 76.7 | 94.9 | 117.4 | 145.3 |
| EBIT, % | 8.79 | 25.7 | 26 | 17.66 | 6.52 | 16.93 | 16.93 | 16.93 | 16.93 | 16.93 |
| Total Cash | 15.6 | 35.7 | 36.0 | 21.0 | 32.4 | 45.1 | 55.8 | 69.0 | 85.4 | 105.7 |
| Total Cash, percent | .0 | .0 | .0 | .0 | .0 | .0 | .0 | .0 | .0 | .0 |
| Account Receivables | 7.0 | 7.8 | 8.7 | 10.1 | 5.8 | 13.1 | 16.2 | 20.1 | 24.9 | 30.8 |
| Account Receivables, % | 5.27 | 3.99 | 3.27 | 3.44 | 1.97 | 3.59 | 3.59 | 3.59 | 3.59 | 3.59 |
| Inventories | 2.4 | 2.7 | 3.9 | 4.4 | 4.7 | 5.6 | 7.0 | 8.6 | 10.7 | 13.2 |
| Inventories, % | 1.79 | 1.36 | 1.45 | 1.5 | 1.58 | 1.54 | 1.54 | 1.54 | 1.54 | 1.54 |
| Accounts Payable | 4.8 | 4.4 | 5.5 | 6.1 | 5.6 | 8.7 | 10.8 | 13.4 | 16.5 | 20.5 |
| Accounts Payable, % | 3.63 | 2.26 | 2.05 | 2.08 | 1.91 | 2.38 | 2.38 | 2.38 | 2.38 | 2.38 |
| Capital Expenditure | -5.7 | -13.5 | -24.0 | -40.4 | -24.6 | -30.9 | -38.3 | -47.4 | -58.6 | -72.6 |
| Capital Expenditure, % | -4.33 | -6.92 | -8.97 | -13.75 | -8.32 | -8.46 | -8.46 | -8.46 | -8.46 | -8.46 |
| Tax Rate, % | -15.45 | -15.45 | -15.45 | -15.45 | -15.45 | -15.45 | -15.45 | -15.45 | -15.45 | -15.45 |
| EBITAT | 10.8 | 44.6 | 53.3 | 42.2 | 22.3 | 54.5 | 67.4 | 83.4 | 103.2 | 127.7 |
| Depreciation | ||||||||||
| Changes in Account Receivables | ||||||||||
| Changes in Inventories | ||||||||||
| Changes in Accounts Payable | ||||||||||
| Capital Expenditure | ||||||||||
| UFCF | 11.0 | 39.5 | 43.2 | 15.7 | 16.6 | 39.6 | 53.0 | 65.6 | 81.1 | 100.4 |
| WACC, % | 6.82 | 6.68 | 6.27 | 6.43 | 7.06 | 6.65 | 6.65 | 6.65 | 6.65 | 6.65 |
| PV UFCF | ||||||||||
| SUM PV UFCF | 273.2 | |||||||||
| Long Term Growth Rate, % | 2.00 | |||||||||
| Free cash flow (T + 1) | 102 | |||||||||
| Terminal Value | 2,201 | |||||||||
| Present Terminal Value | 1,595 | |||||||||
| Enterprise Value | 1,868 | |||||||||
| Net Debt | 243 | |||||||||
| Equity Value | 1,625 | |||||||||
| Diluted Shares Outstanding, MM | 9 | |||||||||
| Equity Value Per Share | 175.70 |
What You Will Receive
- Customizable Excel Template: A fully adjustable Excel-based DCF Calculator featuring pre-loaded real RICK financials.
- Actual Market Data: Historical figures and future projections (as highlighted in the yellow cells).
- Flexible Forecasting: Modify forecast parameters such as revenue growth, EBITDA %, and WACC.
- Instant Calculations: Quickly observe how your inputs influence RCI Hospitality's valuation.
- Professional Resource: Designed for investors, CFOs, consultants, and financial analysts.
- User-Centric Interface: Organized for simplicity and user-friendliness, complete with step-by-step guidance.
Key Features
- Real-Life RICK Data: Pre-filled with RCI Hospitality Holdings' historical financials and future projections.
- Fully Customizable Inputs: Modify revenue growth, profit margins, WACC, tax rates, and capital expenditures.
- Dynamic Valuation Model: Automatic adjustments to Net Present Value (NPV) and intrinsic value based on your inputs.
- Scenario Testing: Generate various forecast scenarios to evaluate different valuation outcomes.
- User-Friendly Design: Intuitive, structured, and suitable for both professionals and novices.
How It Works
- Step 1: Download the Excel file.
- Step 2: Review pre-entered RCI Hospitality Holdings, Inc. (RICK) data (historical and projected).
- Step 3: Adjust key assumptions (yellow cells) based on your analysis.
- Step 4: View automatic recalculations for RCI Hospitality Holdings, Inc. (RICK)’s intrinsic value.
- Step 5: Use the outputs for investment decisions or reporting.
Why Choose RCI Hospitality Holdings, Inc. (RICK)?
- Proven Track Record: A history of consistent growth and profitability in the hospitality sector.
- Expert Management: Led by a team with extensive experience in the industry.
- Diverse Portfolio: A wide range of offerings that cater to various customer preferences.
- Commitment to Quality: Focused on delivering exceptional service and experiences.
- Strong Market Position: Well-established presence that enhances competitive advantage.
Who Should Use RCI Hospitality Holdings, Inc. (RICK)?
- Investors: Make informed investment choices with insights from a leading hospitality company.
- Financial Analysts: Streamline your analysis with comprehensive financial data and reports.
- Consultants: Easily customize presentations and proposals based on RICK's performance metrics.
- Hospitality Enthusiasts: Enhance your knowledge of the industry through RICK's market strategies and operations.
- Educators and Students: Utilize RICK as a case study for courses in finance and hospitality management.
What the Template Contains
- Historical Data: Includes RCI Hospitality Holdings, Inc.’s (RICK) past financials and baseline forecasts.
- DCF and Levered DCF Models: Detailed templates to calculate RCI Hospitality Holdings, Inc.’s (RICK) intrinsic value.
- WACC Sheet: Pre-built calculations for Weighted Average Cost of Capital.
- Editable Inputs: Modify key drivers like growth rates, EBITDA %, and CAPEX assumptions.
- Quarterly and Annual Statements: A complete breakdown of RCI Hospitality Holdings, Inc.’s (RICK) financials.
- Interactive Dashboard: Visualize valuation results and projections dynamically.
Disclaimer
All information, articles, and product details provided on this website are for general informational and educational purposes only. We do not claim any ownership over, nor do we intend to infringe upon, any trademarks, copyrights, logos, brand names, or other intellectual property mentioned or depicted on this site. Such intellectual property remains the property of its respective owners, and any references here are made solely for identification or informational purposes, without implying any affiliation, endorsement, or partnership.
We make no representations or warranties, express or implied, regarding the accuracy, completeness, or suitability of any content or products presented. Nothing on this website should be construed as legal, tax, investment, financial, medical, or other professional advice. In addition, no part of this site—including articles or product references—constitutes a solicitation, recommendation, endorsement, advertisement, or offer to buy or sell any securities, franchises, or other financial instruments, particularly in jurisdictions where such activity would be unlawful.
All content is of a general nature and may not address the specific circumstances of any individual or entity. It is not a substitute for professional advice or services. Any actions you take based on the information provided here are strictly at your own risk. You accept full responsibility for any decisions or outcomes arising from your use of this website and agree to release us from any liability in connection with your use of, or reliance upon, the content or products found herein.