
|
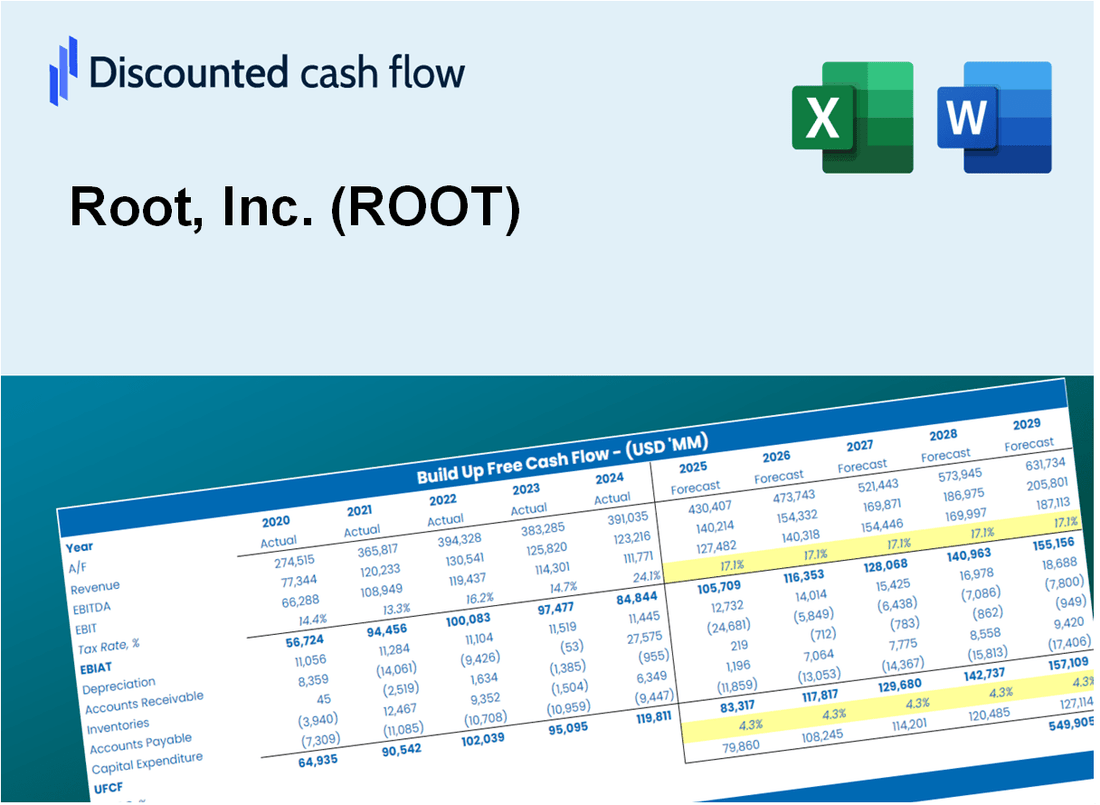
Valoración DCF de Root, Inc. (ROOT) |
Completamente Editable: Adáptelo A Sus Necesidades En Excel O Sheets
Diseño Profesional: Plantillas Confiables Y Estándares De La Industria
Predeterminadas Para Un Uso Rápido Y Eficiente
Compatible con MAC / PC, completamente desbloqueado
No Se Necesita Experiencia; Fáciles De Seguir
Root, Inc. (ROOT) Bundle
Diseñada para la precisión, nuestra calculadora DCF (root) le permite evaluar la valoración de Root, Inc. utilizando datos financieros del mundo real y proporciona flexibilidad completa para modificar todos los parámetros esenciales para las proyecciones mejoradas.
Discounted Cash Flow (DCF) - (USD MM)
| Year | AY1 2020 |
AY2 2021 |
AY3 2022 |
AY4 2023 |
AY5 2024 |
FY1 2025 |
FY2 2026 |
FY3 2027 |
FY4 2028 |
FY5 2029 |
|---|---|---|---|---|---|---|---|---|---|---|
| Revenue | 346.8 | 345.4 | 310.8 | 455.0 | 1,176.5 | 1,576.4 | 2,112.3 | 2,830.4 | 3,792.5 | 5,081.8 |
| Revenue Growth, % | 0 | -0.40369 | -10.02 | 46.4 | 158.57 | 33.99 | 33.99 | 33.99 | 33.99 | 33.99 |
| EBITDA | -269.7 | -484.5 | -249.3 | -88.7 | 88.0 | -851.3 | -1,140.6 | -1,528.4 | -2,047.9 | -2,744.1 |
| EBITDA, % | -77.77 | -140.27 | -80.21 | -19.49 | 7.48 | -54 | -54 | -54 | -54 | -54 |
| Depreciation | 15.6 | 16.6 | 13.8 | 12.6 | 14.9 | 56.1 | 75.1 | 100.6 | 134.9 | 180.7 |
| Depreciation, % | 4.5 | 4.81 | 4.44 | 2.77 | 1.27 | 3.56 | 3.56 | 3.56 | 3.56 | 3.56 |
| EBIT | -285.3 | -501.1 | -263.1 | -101.3 | 73.1 | -892.2 | -1,195.4 | -1,601.8 | -2,146.4 | -2,876.0 |
| EBIT, % | -82.27 | -145.08 | -84.65 | -22.26 | 6.21 | -56.59 | -56.59 | -56.59 | -56.59 | -56.59 |
| Total Cash | 1,336.8 | 835.9 | 890.9 | 678.7 | 230.4 | 1,322.9 | 1,772.6 | 2,375.2 | 3,182.6 | 4,264.5 |
| Total Cash, percent | .0 | .0 | .0 | .0 | .0 | .0 | .0 | .0 | .0 | .0 |
| Account Receivables | .0 | .0 | .0 | .0 | 455.9 | 122.2 | 163.7 | 219.4 | 293.9 | 393.8 |
| Account Receivables, % | 0 | 0 | 0 | 0 | 38.75 | 7.75 | 7.75 | 7.75 | 7.75 | 7.75 |
| Inventories | .0 | .0 | .0 | .0 | .0 | .0 | .0 | .0 | .0 | .0 |
| Inventories, % | 0 | 0 | 0 | 0 | 0 | 0 | 0 | 0 | 0 | 0 |
| Accounts Payable | 137.1 | 130.7 | 159.5 | 120.0 | 103.9 | 516.7 | 692.4 | 927.8 | 1,243.2 | 1,665.8 |
| Accounts Payable, % | 39.53 | 37.84 | 51.32 | 26.37 | 8.83 | 32.78 | 32.78 | 32.78 | 32.78 | 32.78 |
| Capital Expenditure | -16.1 | -11.2 | -10.1 | -9.4 | -11.8 | -44.8 | -60.0 | -80.4 | -107.7 | -144.4 |
| Capital Expenditure, % | -4.64 | -3.24 | -3.25 | -2.07 | -1 | -2.84 | -2.84 | -2.84 | -2.84 | -2.84 |
| Tax Rate, % | 0 | 0 | 0 | 0 | 0 | 0 | 0 | 0 | 0 | 0 |
| EBITAT | -285.3 | -501.1 | -263.1 | -101.3 | 73.1 | -892.2 | -1,195.4 | -1,601.8 | -2,146.4 | -2,876.0 |
| Depreciation | ||||||||||
| Changes in Account Receivables | ||||||||||
| Changes in Inventories | ||||||||||
| Changes in Accounts Payable | ||||||||||
| Capital Expenditure | ||||||||||
| UFCF | -148.7 | -502.1 | -230.6 | -137.6 | -395.8 | -134.3 | -1,046.2 | -1,401.9 | -1,878.4 | -2,516.9 |
| WACC, % | 16.83 | 16.83 | 16.83 | 16.83 | 16.83 | 16.83 | 16.83 | 16.83 | 16.83 | 16.83 |
| PV UFCF | ||||||||||
| SUM PV UFCF | -3,925.1 | |||||||||
| Long Term Growth Rate, % | 2.00 | |||||||||
| Free cash flow (T + 1) | -2,567 | |||||||||
| Terminal Value | -17,310 | |||||||||
| Present Terminal Value | -7,953 | |||||||||
| Enterprise Value | -11,878 | |||||||||
| Net Debt | -399 | |||||||||
| Equity Value | -11,478 | |||||||||
| Diluted Shares Outstanding, MM | 17 | |||||||||
| Equity Value Per Share | -679.20 |
What You Will Get
- Comprehensive ROOT Financials: Access historical and projected data for precise valuation.
- Customizable Inputs: Adjust WACC, tax rates, revenue growth, and capital expenditures as needed.
- Dynamic Calculations: Intrinsic value and NPV are computed automatically.
- Scenario Analysis: Explore various scenarios to assess Root, Inc.'s future performance.
- User-Friendly Design: Designed for professionals but easy to navigate for newcomers.
Key Features
- Comprehensive DCF Calculator: Offers detailed unlevered and levered DCF valuation frameworks tailored for Root, Inc. (ROOT).
- WACC Calculator: Includes a pre-structured Weighted Average Cost of Capital sheet with adjustable parameters.
- Customizable Forecast Assumptions: Easily adjust growth rates, capital expenditures, and discount rates.
- Integrated Financial Ratios: Evaluate profitability, leverage, and efficiency ratios specific to Root, Inc. (ROOT).
- Interactive Dashboard and Charts: Visual representations that highlight essential valuation metrics for straightforward analysis.
How It Works
- 1. Access the Model: Download and open the Excel template featuring Root, Inc.'s (ROOT) financial data.
- 2. Adjust Key Inputs: Modify critical variables such as growth projections, discount rates, and capital investments.
- 3. Analyze Results in Real-Time: The DCF model automatically computes the intrinsic value and net present value (NPV).
- 4. Explore Different Scenarios: Evaluate various forecasts to understand diverse valuation possibilities.
- 5. Make Informed Decisions: Share comprehensive valuation analyses to bolster your strategic choices.
Why Choose This Calculator for Root, Inc. (ROOT)?
- User-Friendly Interface: Designed to accommodate both novices and seasoned professionals.
- Customizable Inputs: Easily adjust parameters to tailor your financial analysis.
- Real-Time Adjustments: Observe immediate updates to Root, Inc.’s valuation with input changes.
- Preloaded Data: Comes equipped with Root, Inc.’s actual financial metrics for swift evaluations.
- Relied Upon by Experts: A preferred tool among investors and analysts for making well-informed choices.
Who Should Use This Product?
- Investors: Accurately assess Root, Inc.'s (ROOT) fair value prior to making investment choices.
- CFOs: Utilize a professional-grade DCF model for comprehensive financial reporting and analysis.
- Consultants: Efficiently customize the template for client valuation reports.
- Entrepreneurs: Acquire insights into financial modeling practices employed by leading companies.
- Educators: Implement it as a teaching resource to illustrate valuation techniques.
What the Template Contains
- Pre-Filled Data: Includes Root, Inc.'s (ROOT) historical financials and forecasts.
- Discounted Cash Flow Model: Editable DCF valuation model with automatic calculations.
- Weighted Average Cost of Capital (WACC): A dedicated sheet for calculating WACC based on custom inputs.
- Key Financial Ratios: Analyze Root, Inc.'s (ROOT) profitability, efficiency, and leverage.
- Customizable Inputs: Edit revenue growth, margins, and tax rates with ease.
- Clear Dashboard: Charts and tables summarizing key valuation results.
Disclaimer
All information, articles, and product details provided on this website are for general informational and educational purposes only. We do not claim any ownership over, nor do we intend to infringe upon, any trademarks, copyrights, logos, brand names, or other intellectual property mentioned or depicted on this site. Such intellectual property remains the property of its respective owners, and any references here are made solely for identification or informational purposes, without implying any affiliation, endorsement, or partnership.
We make no representations or warranties, express or implied, regarding the accuracy, completeness, or suitability of any content or products presented. Nothing on this website should be construed as legal, tax, investment, financial, medical, or other professional advice. In addition, no part of this site—including articles or product references—constitutes a solicitation, recommendation, endorsement, advertisement, or offer to buy or sell any securities, franchises, or other financial instruments, particularly in jurisdictions where such activity would be unlawful.
All content is of a general nature and may not address the specific circumstances of any individual or entity. It is not a substitute for professional advice or services. Any actions you take based on the information provided here are strictly at your own risk. You accept full responsibility for any decisions or outcomes arising from your use of this website and agree to release us from any liability in connection with your use of, or reliance upon, the content or products found herein.