
|
Valoración DCF de Repay Holdings Corporation (RPAY) |
Completamente Editable: Adáptelo A Sus Necesidades En Excel O Sheets
Diseño Profesional: Plantillas Confiables Y Estándares De La Industria
Predeterminadas Para Un Uso Rápido Y Eficiente
Compatible con MAC / PC, completamente desbloqueado
No Se Necesita Experiencia; Fáciles De Seguir
Repay Holdings Corporation (RPAY) Bundle
¡Obtenga información sobre su Análisis de valoración de Bairshing Holdings Corporation (RPAY) utilizando nuestra calculadora DCF de vanguardia! Con datos en tiempo real para (RPAY), esta plantilla de Excel le permite ajustar los pronósticos y los supuestos para determinar con precisión el valor intrínseco de Repaid Holdings Corporation.
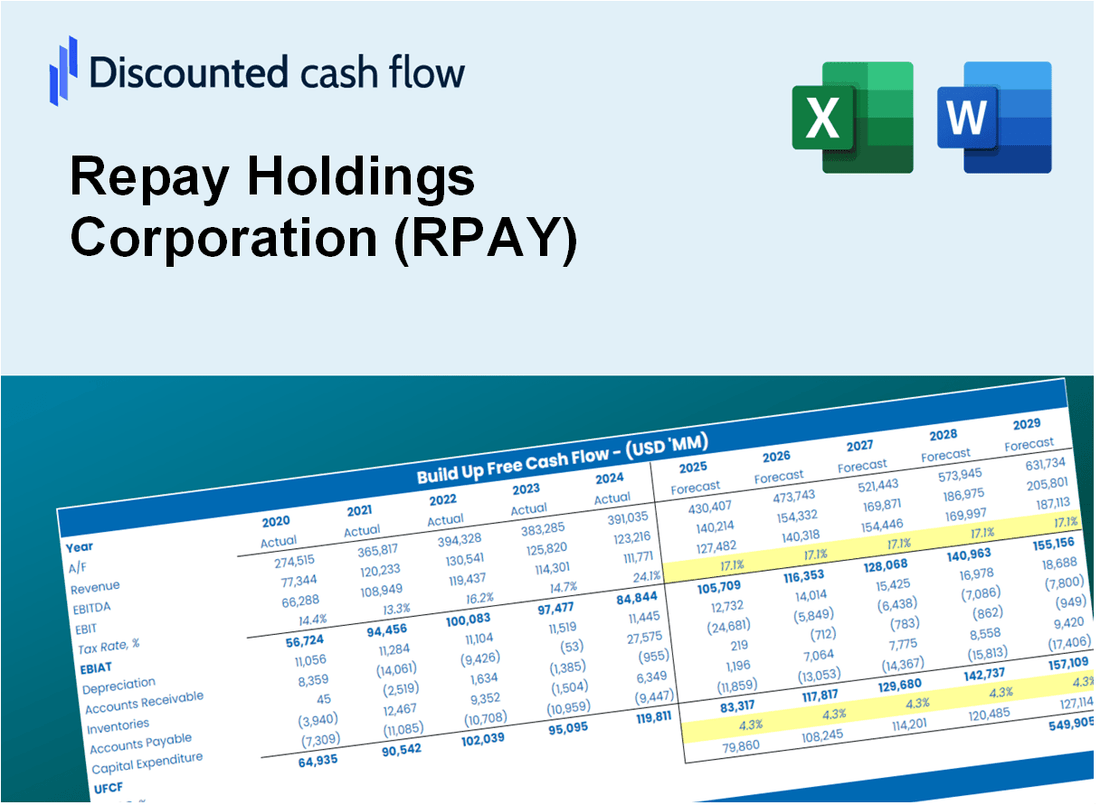
Discounted Cash Flow (DCF) - (USD MM)
| Year | AY1 2020 |
AY2 2021 |
AY3 2022 |
AY4 2023 |
AY5 2024 |
FY1 2025 |
FY2 2026 |
FY3 2027 |
FY4 2028 |
FY5 2029 |
|---|---|---|---|---|---|---|---|---|---|---|
| Revenue | 155.0 | 219.3 | 279.2 | 296.6 | 313.0 | 376.1 | 451.8 | 542.8 | 652.1 | 783.3 |
| Revenue Growth, % | 0 | 41.42 | 27.35 | 6.23 | 5.53 | 20.14 | 20.14 | 20.14 | 20.14 | 20.14 |
| EBITDA | -54.5 | 43.7 | 65.3 | 78.3 | 100.7 | 50.2 | 60.3 | 72.5 | 87.0 | 104.6 |
| EBITDA, % | -35.14 | 19.94 | 23.4 | 26.39 | 32.16 | 13.35 | 13.35 | 13.35 | 13.35 | 13.35 |
| Depreciation | 60.8 | 89.7 | 107.8 | 103.9 | 103.7 | 140.5 | 168.8 | 202.8 | 243.7 | 292.7 |
| Depreciation, % | 39.22 | 40.91 | 38.59 | 35.01 | 33.13 | 37.37 | 37.37 | 37.37 | 37.37 | 37.37 |
| EBIT | -115.3 | -46.0 | -42.4 | -25.6 | -3.0 | -90.3 | -108.5 | -130.4 | -156.6 | -188.2 |
| EBIT, % | -74.36 | -20.97 | -15.19 | -8.63 | -0.97335 | -24.02 | -24.02 | -24.02 | -24.02 | -24.02 |
| Total Cash | 91.1 | 50.0 | 64.9 | 118.1 | 189.5 | 154.3 | 185.4 | 222.8 | 267.6 | 321.5 |
| Total Cash, percent | .0 | .0 | .0 | .0 | .0 | .0 | .0 | .0 | .0 | .0 |
| Account Receivables | 21.3 | 33.2 | 33.5 | 36.0 | 33.0 | 47.8 | 57.5 | 69.0 | 82.9 | 99.6 |
| Account Receivables, % | 13.75 | 15.16 | 12.01 | 12.14 | 10.53 | 12.72 | 12.72 | 12.72 | 12.72 | 12.72 |
| Inventories | .0 | .0 | .0 | .0 | .0 | .0 | .0 | .0 | .0 | .0 |
| Inventories, % | 0 | 0 | 0 | 0 | 0 | 0 | 0 | 0 | 0 | 0 |
| Accounts Payable | 11.9 | 20.1 | 21.8 | 22.0 | 28.9 | 31.1 | 37.3 | 44.8 | 53.8 | 64.7 |
| Accounts Payable, % | 7.66 | 9.16 | 7.8 | 7.43 | 9.24 | 8.26 | 8.26 | 8.26 | 8.26 | 8.26 |
| Capital Expenditure | -24.3 | -23.5 | -39.5 | -.7 | -1.0 | -30.9 | -37.1 | -44.6 | -53.6 | -64.4 |
| Capital Expenditure, % | -15.66 | -10.72 | -14.16 | -0.24711 | -0.31593 | -8.22 | -8.22 | -8.22 | -8.22 | -8.22 |
| Tax Rate, % | 7 | 7 | 7 | 7 | 7 | 7 | 7 | 7 | 7 | 7 |
| EBITAT | -93.8 | -26.5 | -36.5 | -23.6 | -2.8 | -74.2 | -89.1 | -107.1 | -128.6 | -154.5 |
| Depreciation | ||||||||||
| Changes in Account Receivables | ||||||||||
| Changes in Inventories | ||||||||||
| Changes in Accounts Payable | ||||||||||
| Capital Expenditure | ||||||||||
| UFCF | -66.7 | 35.9 | 33.1 | 77.3 | 109.8 | 22.7 | 39.2 | 47.1 | 56.6 | 68.0 |
| WACC, % | 6.58 | 6.08 | 6.68 | 6.82 | 6.83 | 6.6 | 6.6 | 6.6 | 6.6 | 6.6 |
| PV UFCF | ||||||||||
| SUM PV UFCF | 187.8 | |||||||||
| Long Term Growth Rate, % | 2.00 | |||||||||
| Free cash flow (T + 1) | 69 | |||||||||
| Terminal Value | 1,507 | |||||||||
| Present Terminal Value | 1,095 | |||||||||
| Enterprise Value | 1,283 | |||||||||
| Net Debt | 319 | |||||||||
| Equity Value | 964 | |||||||||
| Diluted Shares Outstanding, MM | 90 | |||||||||
| Equity Value Per Share | 10.72 |
What You Will Get
- Real Repay Holdings Data: Preloaded financials – from revenue to EBIT – based on actual and projected figures for Repay Holdings Corporation (RPAY).
- Full Customization: Adjust all critical parameters (yellow cells) like WACC, growth %, and tax rates to suit your analysis needs.
- Instant Valuation Updates: Automatic recalculations to evaluate the impact of changes on Repay Holdings Corporation’s (RPAY) fair value.
- Versatile Excel Template: Designed for quick edits, scenario testing, and comprehensive projections tailored to Repay Holdings Corporation (RPAY).
- Time-Saving and Accurate: Avoid the hassle of building models from scratch while ensuring precision and flexibility in your financial analysis.
Key Features
- Customizable Financial Inputs: Adjust essential parameters such as transaction volume, revenue growth, and operating expenses.
- Instant DCF Valuation: Automatically computes intrinsic value, NPV, and various financial metrics on demand.
- High-Precision Accuracy: Leverages Repay's actual financial data for credible valuation results.
- Streamlined Scenario Analysis: Effortlessly explore different scenarios and evaluate their impacts.
- Efficiency Booster: Avoid the hassle of creating intricate valuation models from the ground up.
How It Works
- Download: Obtain the pre-built Excel file featuring Repay Holdings Corporation’s (RPAY) financial data.
- Customize: Modify projections, such as revenue growth, EBITDA %, and WACC.
- Update Automatically: The intrinsic value and NPV calculations refresh in real-time.
- Test Scenarios: Generate various forecasts and instantly compare results.
- Make Decisions: Utilize the valuation findings to inform your investment approach.
Why Choose This Calculator for Repay Holdings Corporation (RPAY)?
- Accuracy: Utilizes real Repay Holdings Corporation financials to ensure precise data.
- Flexibility: Tailored for users to easily test and adjust inputs as needed.
- Time-Saving: Eliminate the complexities of constructing a DCF model from the ground up.
- Professional-Grade: Crafted with the expertise and usability expected at the CFO level.
- User-Friendly: Intuitive design makes it accessible for users without extensive financial modeling skills.
Who Should Use Repay Holdings Corporation (RPAY)?
- Financial Analysts: Develop comprehensive models to assess the financial health of Repay Holdings Corporation (RPAY).
- Investment Managers: Evaluate investment opportunities and risks associated with Repay Holdings Corporation (RPAY).
- Business Consultants: Offer strategic insights and valuation assessments for clients interested in Repay Holdings Corporation (RPAY).
- Academic Researchers: Utilize empirical data to study trends and performance in the payments sector, focusing on Repay Holdings Corporation (RPAY).
- Market Enthusiasts: Gain insights into the valuation and market positioning of Repay Holdings Corporation (RPAY).
What the Template Contains
- Preloaded RPAY Data: Historical and projected financial data, including revenue, EBIT, and capital expenditures.
- DCF and WACC Models: Professional-grade sheets for calculating intrinsic value and Weighted Average Cost of Capital.
- Editable Inputs: Yellow-highlighted cells for adjusting revenue growth, tax rates, and discount rates.
- Financial Statements: Comprehensive annual and quarterly financials for deeper analysis.
- Key Ratios: Profitability, leverage, and efficiency ratios to evaluate performance.
- Dashboard and Charts: Visual summaries of valuation outcomes and assumptions.
Disclaimer
All information, articles, and product details provided on this website are for general informational and educational purposes only. We do not claim any ownership over, nor do we intend to infringe upon, any trademarks, copyrights, logos, brand names, or other intellectual property mentioned or depicted on this site. Such intellectual property remains the property of its respective owners, and any references here are made solely for identification or informational purposes, without implying any affiliation, endorsement, or partnership.
We make no representations or warranties, express or implied, regarding the accuracy, completeness, or suitability of any content or products presented. Nothing on this website should be construed as legal, tax, investment, financial, medical, or other professional advice. In addition, no part of this site—including articles or product references—constitutes a solicitation, recommendation, endorsement, advertisement, or offer to buy or sell any securities, franchises, or other financial instruments, particularly in jurisdictions where such activity would be unlawful.
All content is of a general nature and may not address the specific circumstances of any individual or entity. It is not a substitute for professional advice or services. Any actions you take based on the information provided here are strictly at your own risk. You accept full responsibility for any decisions or outcomes arising from your use of this website and agree to release us from any liability in connection with your use of, or reliance upon, the content or products found herein.