
|
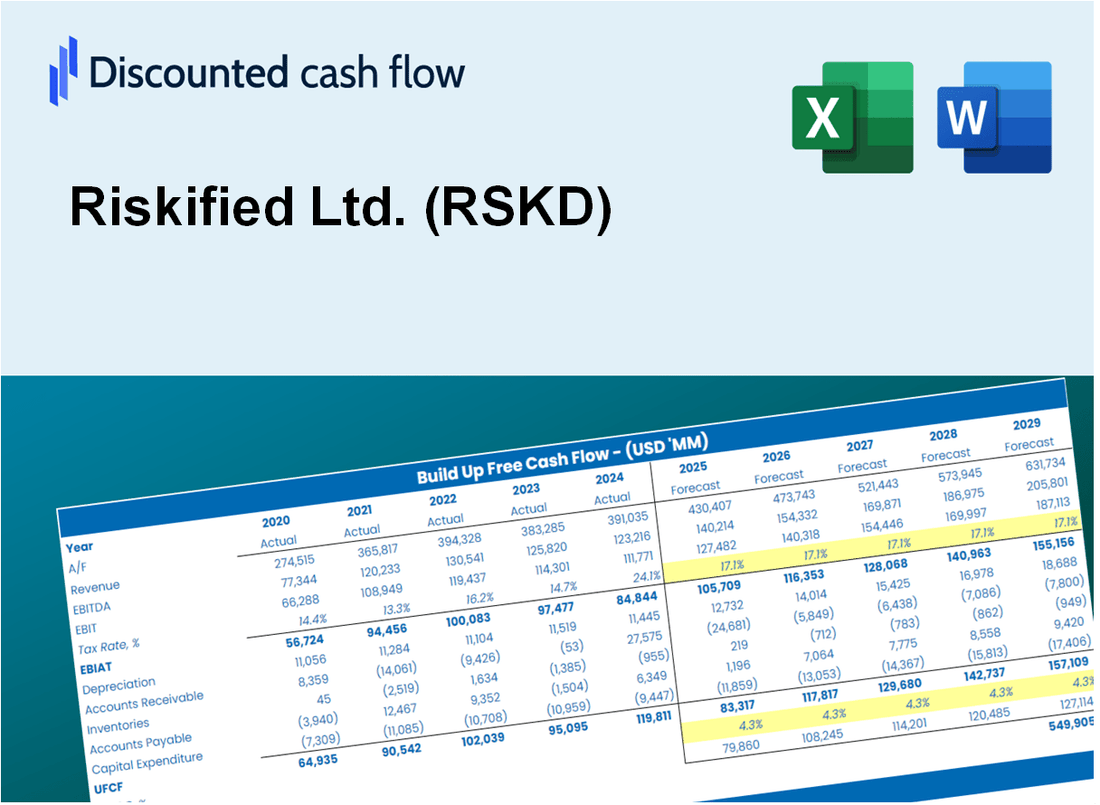
Valoración DCF de Riskified Ltd. (RSKD) |
Completamente Editable: Adáptelo A Sus Necesidades En Excel O Sheets
Diseño Profesional: Plantillas Confiables Y Estándares De La Industria
Predeterminadas Para Un Uso Rápido Y Eficiente
Compatible con MAC / PC, completamente desbloqueado
No Se Necesita Experiencia; Fáciles De Seguir
Riskified Ltd. (RSKD) Bundle
Diseñada para la precisión, nuestra calculadora DCF de Ltd. (RSKD) de Riskified le permite evaluar la valoración de la Compañía utilizando datos financieros reales, ofreciendo una flexibilidad completa para modificar todos los parámetros esenciales para mejorar las proyecciones.
Discounted Cash Flow (DCF) - (USD MM)
| Year | AY1 2020 |
AY2 2021 |
AY3 2022 |
AY4 2023 |
AY5 2024 |
FY1 2025 |
FY2 2026 |
FY3 2027 |
FY4 2028 |
FY5 2029 |
|---|---|---|---|---|---|---|---|---|---|---|
| Revenue | 169.7 | 229.1 | 261.2 | 297.6 | 327.5 | 387.3 | 457.9 | 541.5 | 640.2 | 757.0 |
| Revenue Growth, % | 0 | 35 | 14.01 | 13.92 | 10.05 | 18.24 | 18.24 | 18.24 | 18.24 | 18.24 |
| EBITDA | -5.4 | -54.0 | -105.7 | -71.7 | -43.0 | -80.9 | -95.7 | -113.1 | -133.8 | -158.2 |
| EBITDA, % | -3.21 | -23.55 | -40.48 | -24.11 | -13.12 | -20.89 | -20.89 | -20.89 | -20.89 | -20.89 |
| Depreciation | 1.4 | 2.0 | 3.6 | 5.1 | 4.9 | 4.8 | 5.7 | 6.8 | 8.0 | 9.5 |
| Depreciation, % | 0.80123 | 0.86846 | 1.38 | 1.71 | 1.49 | 1.25 | 1.25 | 1.25 | 1.25 | 1.25 |
| EBIT | -6.8 | -55.9 | -109.3 | -76.8 | -47.9 | -85.8 | -101.4 | -119.9 | -141.8 | -167.6 |
| EBIT, % | -4.01 | -24.41 | -41.86 | -25.82 | -14.61 | -22.14 | -22.14 | -22.14 | -22.14 | -22.14 |
| Total Cash | 117.6 | 503.3 | 475.7 | 474.8 | 376.1 | 363.5 | 429.8 | 508.2 | 600.9 | 710.6 |
| Total Cash, percent | .0 | .0 | .0 | .0 | .0 | .0 | .0 | .0 | .0 | .0 |
| Account Receivables | 39.2 | 35.5 | 37.5 | 46.9 | 47.8 | 64.5 | 76.3 | 90.2 | 106.7 | 126.2 |
| Account Receivables, % | 23.12 | 15.48 | 14.37 | 15.75 | 14.6 | 16.66 | 16.66 | 16.66 | 16.66 | 16.66 |
| Inventories | 6.5 | .0 | .0 | .0 | .0 | 3.0 | 3.5 | 4.2 | 4.9 | 5.8 |
| Inventories, % | 3.86 | 0 | 0 | 0 | 0 | 0.77106 | 0.77106 | 0.77106 | 0.77106 | 0.77106 |
| Accounts Payable | 1.5 | .2 | 2.1 | 2.6 | 2.3 | 2.6 | 3.1 | 3.6 | 4.3 | 5.1 |
| Accounts Payable, % | 0.88783 | 0.09950205 | 0.80766 | 0.86455 | 0.705 | 0.67291 | 0.67291 | 0.67291 | 0.67291 | 0.67291 |
| Capital Expenditure | -3.0 | -13.5 | -8.0 | -1.4 | -.6 | -8.8 | -10.4 | -12.3 | -14.5 | -17.2 |
| Capital Expenditure, % | -1.74 | -5.89 | -3.07 | -0.45529 | -0.19449 | -2.27 | -2.27 | -2.27 | -2.27 | -2.27 |
| Tax Rate, % | -22.52 | -22.52 | -22.52 | -22.52 | -22.52 | -22.52 | -22.52 | -22.52 | -22.52 | -22.52 |
| EBITAT | -7.5 | -56.4 | -116.0 | -85.2 | -58.6 | -85.8 | -101.4 | -119.9 | -141.8 | -167.6 |
| Depreciation | ||||||||||
| Changes in Account Receivables | ||||||||||
| Changes in Inventories | ||||||||||
| Changes in Accounts Payable | ||||||||||
| Capital Expenditure | ||||||||||
| UFCF | -53.4 | -58.9 | -120.6 | -90.3 | -55.6 | -109.1 | -117.9 | -139.4 | -164.9 | -194.9 |
| WACC, % | 9.91 | 9.91 | 9.91 | 9.91 | 9.91 | 9.91 | 9.91 | 9.91 | 9.91 | 9.91 |
| PV UFCF | ||||||||||
| SUM PV UFCF | -536.3 | |||||||||
| Long Term Growth Rate, % | 2.00 | |||||||||
| Free cash flow (T + 1) | -199 | |||||||||
| Terminal Value | -2,512 | |||||||||
| Present Terminal Value | -1,566 | |||||||||
| Enterprise Value | -2,102 | |||||||||
| Net Debt | -344 | |||||||||
| Equity Value | -1,759 | |||||||||
| Diluted Shares Outstanding, MM | 171 | |||||||||
| Equity Value Per Share | -10.29 |
What You Will Get
- Real RSKD Financial Data: Pre-filled with Riskified’s historical and projected data for precise analysis.
- Fully Editable Template: Modify key inputs like revenue growth, WACC, and EBITDA % with ease.
- Automatic Calculations: See Riskified’s intrinsic value update instantly based on your changes.
- Professional Valuation Tool: Designed for investors, analysts, and consultants seeking accurate DCF results.
- User-Friendly Design: Simple structure and clear instructions for all experience levels.
Key Features
- Comprehensive Risk Assessment: Access detailed pre-loaded historical data and future risk projections for Riskified Ltd. (RSKD).
- Tailored Risk Parameters: Modify highlighted cells for factors like chargeback rates, fraud detection metrics, and operational costs.
- Real-Time Analytics: Instant updates to risk models, loss forecasts, and performance metrics.
- Interactive Dashboard: User-friendly charts and summaries to effectively visualize your risk management outcomes.
- Designed for All Levels: An intuitive layout suitable for investors, risk managers, and business analysts.
How It Works
- 1. Download the Model: Obtain and open the Excel template featuring Riskified Ltd.'s (RSKD) financial data.
- 2. Adjust Key Inputs: Modify essential variables such as revenue growth, cost of capital, and investment expenses.
- 3. Analyze Immediate Outputs: The DCF model automatically computes the intrinsic value and net present value (NPV).
- 4. Explore Various Scenarios: Evaluate different projections to assess a range of valuation possibilities.
- 5. Present with Assurance: Deliver expert valuation analysis to enhance your strategic decisions.
Why Choose Riskified Ltd. (RSKD)?
- Enhance Efficiency: Streamlined processes mean you can focus on growth without the hassle.
- Boost Accuracy: Advanced algorithms and data analytics minimize errors in transaction approvals.
- Highly Adaptable: Customize solutions to meet your unique business needs and risk profiles.
- User-Friendly Interface: Intuitive dashboards and reports simplify decision-making.
- Preferred by Industry Leaders: Trusted by top brands for its reliability and effectiveness.
Who Should Use Riskified Ltd. (RSKD)?
- E-commerce Businesses: Enhance fraud detection and improve transaction approvals for online sales.
- Financial Analysts: Evaluate the impact of risk management solutions on profit margins.
- Investors: Gain insights into the company's performance and growth potential in the fintech sector.
- Students and Educators: Study real-world applications of risk management in digital commerce.
- Tech Innovators: Explore the technological advancements in fraud prevention and their market implications.
What the Template Contains
- Operating and Balance Sheet Data: Pre-filled Riskified Ltd. historical data and forecasts, including revenue, EBITDA, EBIT, and capital expenditures.
- WACC Calculation: A dedicated sheet for Weighted Average Cost of Capital (WACC), including parameters like Beta, risk-free rate, and share price.
- DCF Valuation (Unlevered and Levered): Editable Discounted Cash Flow models showing intrinsic value with detailed calculations.
- Financial Statements: Pre-loaded financial statements (annual and quarterly) to support analysis.
- Key Ratios: Includes profitability, leverage, and efficiency ratios for Riskified Ltd. (RSKD).
- Dashboard and Charts: Visual summary of valuation outputs and assumptions to analyze results easily.
Disclaimer
All information, articles, and product details provided on this website are for general informational and educational purposes only. We do not claim any ownership over, nor do we intend to infringe upon, any trademarks, copyrights, logos, brand names, or other intellectual property mentioned or depicted on this site. Such intellectual property remains the property of its respective owners, and any references here are made solely for identification or informational purposes, without implying any affiliation, endorsement, or partnership.
We make no representations or warranties, express or implied, regarding the accuracy, completeness, or suitability of any content or products presented. Nothing on this website should be construed as legal, tax, investment, financial, medical, or other professional advice. In addition, no part of this site—including articles or product references—constitutes a solicitation, recommendation, endorsement, advertisement, or offer to buy or sell any securities, franchises, or other financial instruments, particularly in jurisdictions where such activity would be unlawful.
All content is of a general nature and may not address the specific circumstances of any individual or entity. It is not a substitute for professional advice or services. Any actions you take based on the information provided here are strictly at your own risk. You accept full responsibility for any decisions or outcomes arising from your use of this website and agree to release us from any liability in connection with your use of, or reliance upon, the content or products found herein.