
|
Rattanindia Enterprises Limited (Rtnindia.ns) Valoración de DCF |
Completamente Editable: Adáptelo A Sus Necesidades En Excel O Sheets
Diseño Profesional: Plantillas Confiables Y Estándares De La Industria
Predeterminadas Para Un Uso Rápido Y Eficiente
Compatible con MAC / PC, completamente desbloqueado
No Se Necesita Experiencia; Fáciles De Seguir
RattanIndia Enterprises Limited (RTNINDIA.NS) Bundle
¿Busca evaluar el valor intrínseco de Rattanindia Enterprises Limited? Nuestra calculadora DCF (RTNINDIANS) integra datos del mundo real con características integrales de personalización, lo que le permite refinar sus pronósticos y mejorar sus estrategias de inversión.
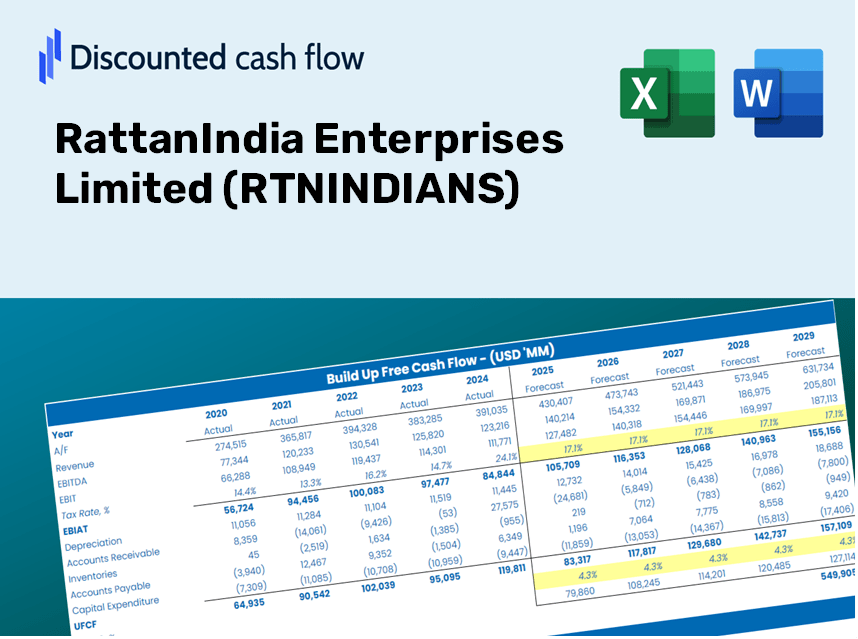
Discounted Cash Flow (DCF) - (USD MM)
| Year | AY1 2021 |
AY2 2022 |
AY3 2023 |
AY4 2024 |
AY5 2025 |
FY1 2026 |
FY2 2027 |
FY3 2028 |
FY4 2029 |
FY5 2030 |
|---|---|---|---|---|---|---|---|---|---|---|
| Revenue | 1.0 | 139.9 | 40,626.0 | 56,096.4 | 68,663.5 | 113,377.6 | 187,209.8 | 309,122.0 | 510,424.3 | 842,816.0 |
| Revenue Growth, % | 0 | 13893 | 28933.09 | 38.08 | 22.4 | 65.12 | 65.12 | 65.12 | 65.12 | 65.12 |
| EBITDA | .5 | 5,704.8 | -2,015.6 | 5,833.1 | 2,622.1 | 35,159.7 | 58,055.9 | 95,862.2 | 158,288.3 | 261,366.7 |
| EBITDA, % | 45.8 | 4076.92 | -4.96 | 10.4 | 3.82 | 31.01 | 31.01 | 31.01 | 31.01 | 31.01 |
| Depreciation | .0 | 12.6 | 98.8 | 172.9 | 160.2 | 2,597.1 | 4,288.4 | 7,081.1 | 11,692.3 | 19,306.4 |
| Depreciation, % | 1.7 | 8.97 | 0.24324 | 0.30826 | 0.23327 | 2.29 | 2.29 | 2.29 | 2.29 | 2.29 |
| EBIT | .4 | 5,692.3 | -2,114.5 | 5,660.1 | 2,461.9 | 34,596.2 | 57,125.5 | 94,326.0 | 155,751.7 | 257,178.3 |
| EBIT, % | 44.1 | 4067.95 | -5.2 | 10.09 | 3.59 | 30.51 | 30.51 | 30.51 | 30.51 | 30.51 |
| Total Cash | 843.9 | 1,612.0 | 1,359.7 | 773.5 | 11,798.2 | 50,318.8 | 83,086.8 | 137,193.5 | 226,534.8 | 374,055.7 |
| Total Cash, percent | .1 | .0 | .0 | .0 | .0 | .0 | .0 | .0 | .0 | .0 |
| Account Receivables | .0 | 24.3 | 1,406.1 | 445.1 | 511.0 | 5,076.1 | 8,381.7 | 13,840.0 | 22,852.7 | 37,734.5 |
| Account Receivables, % | 0 | 17.39 | 3.46 | 0.79344 | 0.74422 | 4.48 | 4.48 | 4.48 | 4.48 | 4.48 |
| Inventories | .0 | 383.8 | 10,716.6 | 9,186.5 | 8,239.4 | 35,091.4 | 57,943.1 | 95,676.1 | 157,981.0 | 260,859.2 |
| Inventories, % | 0 | 274.25 | 26.38 | 16.38 | 12 | 30.95 | 30.95 | 30.95 | 30.95 | 30.95 |
| Accounts Payable | .0 | 479.1 | 6,639.8 | 5,565.3 | 6,379.9 | 30,738.1 | 50,754.9 | 83,806.8 | 138,382.4 | 228,497.9 |
| Accounts Payable, % | 0 | 342.39 | 16.34 | 9.92 | 9.29 | 27.11 | 27.11 | 27.11 | 27.11 | 27.11 |
| Capital Expenditure | .0 | -6.2 | -130.1 | -23.1 | -21.4 | -1,085.6 | -1,792.6 | -2,959.9 | -4,887.5 | -8,070.2 |
| Capital Expenditure, % | 0 | -4.4 | -0.32029 | -0.04116132 | -0.03113738 | -0.95753 | -0.95753 | -0.95753 | -0.95753 | -0.95753 |
| Tax Rate, % | 44.42 | 44.42 | 44.42 | 44.42 | 44.42 | 44.42 | 44.42 | 44.42 | 44.42 | 44.42 |
| EBITAT | .4 | 5,690.2 | -2,201.6 | 5,330.5 | 1,368.4 | 31,117.3 | 51,381.2 | 84,840.9 | 140,089.9 | 231,317.3 |
| Depreciation | ||||||||||
| Changes in Account Receivables | ||||||||||
| Changes in Inventories | ||||||||||
| Changes in Accounts Payable | ||||||||||
| Capital Expenditure | ||||||||||
| UFCF | .5 | 5,767.6 | -7,786.7 | 6,896.9 | 3,203.0 | 25,569.9 | 47,736.5 | 78,822.8 | 130,152.7 | 214,909.0 |
| WACC, % | 5.77 | 5.77 | 5.77 | 5.7 | 5.26 | 5.65 | 5.65 | 5.65 | 5.65 | 5.65 |
| PV UFCF | ||||||||||
| SUM PV UFCF | 401,490.7 | |||||||||
| Long Term Growth Rate, % | 2.00 | |||||||||
| Free cash flow (T + 1) | 219,207 | |||||||||
| Terminal Value | 5,999,324 | |||||||||
| Present Terminal Value | 4,556,962 | |||||||||
| Enterprise Value | 4,958,453 | |||||||||
| Net Debt | 7,928 | |||||||||
| Equity Value | 4,950,525 | |||||||||
| Diluted Shares Outstanding, MM | 1,384 | |||||||||
| Equity Value Per Share | 3,576.50 |
What You Will Receive
- Authentic RTNINDIANS Financial Data: Pre-loaded with RattanIndia Enterprises Limited’s historical and forecasted metrics for accurate analysis.
- Completely Customizable Template: Easily adjust key inputs such as revenue growth, WACC, and EBITDA percentages.
- Instantaneous Calculations: Watch the intrinsic value of RattanIndia Enterprises Limited update in real-time as you make adjustments.
- Expert Valuation Tool: Tailored for investors, analysts, and consultants aiming for precise DCF outcomes.
- Intuitive User Interface: Straightforward layout and clear guidance suitable for all skill levels.
Key Features
- Comprehensive DCF Calculator: Offers detailed unlevered and levered DCF valuation models tailored for RattanIndia Enterprises Limited (RTNINDIANS).
- WACC Calculator: Pre-configured Weighted Average Cost of Capital sheet with adjustable inputs specific to RTNINDIANS.
- Customizable Forecast Assumptions: Easily adapt growth rates, capital expenditures, and discount rates to fit your analysis.
- Integrated Financial Ratios: Evaluate profitability, leverage, and efficiency ratios for RattanIndia Enterprises Limited (RTNINDIANS).
- Interactive Dashboard and Charts: Visual representations of key valuation metrics for streamlined analysis.
How It Works
- 1. Access the Template: Download the Excel file containing RattanIndia Enterprises Limited's (RTNINDIANS) preloaded data.
- 2. Modify Assumptions: Adjust essential inputs such as growth rates, WACC, and capital expenditures.
- 3. See Results Immediately: The DCF model provides real-time calculations for intrinsic value and NPV.
- 4. Explore Scenarios: Evaluate various forecasts to assess different valuation possibilities.
- 5. Present with Assurance: Deliver professional valuation insights to bolster your decision-making process.
Why Choose the RattanIndia Enterprises Limited (RTNINDIANS) Calculator?
- User-Friendly Design: Tailored for both novices and seasoned users.
- Customizable Inputs: Adjust parameters effortlessly to fit your specific analysis.
- Real-Time Valuation: Observe immediate changes to RattanIndia's value as you modify inputs.
- Preloaded Data: Comes equipped with RattanIndia’s actual financial figures for swift evaluations.
- Preferred Resource: Endorsed by investors and analysts for sound decision-making.
Who Can Benefit from Using RattanIndia Enterprises Limited (RTNINDIANS)?
- Investors: Evaluate RattanIndia’s market position before making stock transactions.
- CFOs and Financial Analysts: Enhance valuation methodologies and validate financial forecasts.
- Startup Founders: Understand the valuation processes of established companies like RattanIndia.
- Consultants: Provide clients with comprehensive valuation assessments and reports.
- Students and Educators: Utilize real-time data for hands-on experience and instruction in valuation strategies.
What the Template Offers
- In-Depth DCF Model: An editable template that includes extensive valuation computations.
- Real-World Data: RattanIndia Enterprises Limited’s (RTNINDIANS) historical and projected financials are preloaded for your analysis.
- Customizable Parameters: Modify WACC, growth rates, and tax assumptions to explore various scenarios.
- Financial Statements: Comprehensive annual and quarterly breakdowns for enhanced insights.
- Key Ratios: Integrated analyses for assessing profitability, efficiency, and leverage.
- Dashboard with Visual Outputs: Visual representations including charts and tables for clear, actionable insights.
Disclaimer
All information, articles, and product details provided on this website are for general informational and educational purposes only. We do not claim any ownership over, nor do we intend to infringe upon, any trademarks, copyrights, logos, brand names, or other intellectual property mentioned or depicted on this site. Such intellectual property remains the property of its respective owners, and any references here are made solely for identification or informational purposes, without implying any affiliation, endorsement, or partnership.
We make no representations or warranties, express or implied, regarding the accuracy, completeness, or suitability of any content or products presented. Nothing on this website should be construed as legal, tax, investment, financial, medical, or other professional advice. In addition, no part of this site—including articles or product references—constitutes a solicitation, recommendation, endorsement, advertisement, or offer to buy or sell any securities, franchises, or other financial instruments, particularly in jurisdictions where such activity would be unlawful.
All content is of a general nature and may not address the specific circumstances of any individual or entity. It is not a substitute for professional advice or services. Any actions you take based on the information provided here are strictly at your own risk. You accept full responsibility for any decisions or outcomes arising from your use of this website and agree to release us from any liability in connection with your use of, or reliance upon, the content or products found herein.