
|
Valoración DCF de Raytheon Technologies Corporation (RTX) |
Completamente Editable: Adáptelo A Sus Necesidades En Excel O Sheets
Diseño Profesional: Plantillas Confiables Y Estándares De La Industria
Predeterminadas Para Un Uso Rápido Y Eficiente
Compatible con MAC / PC, completamente desbloqueado
No Se Necesita Experiencia; Fáciles De Seguir
Raytheon Technologies Corporation (RTX) Bundle
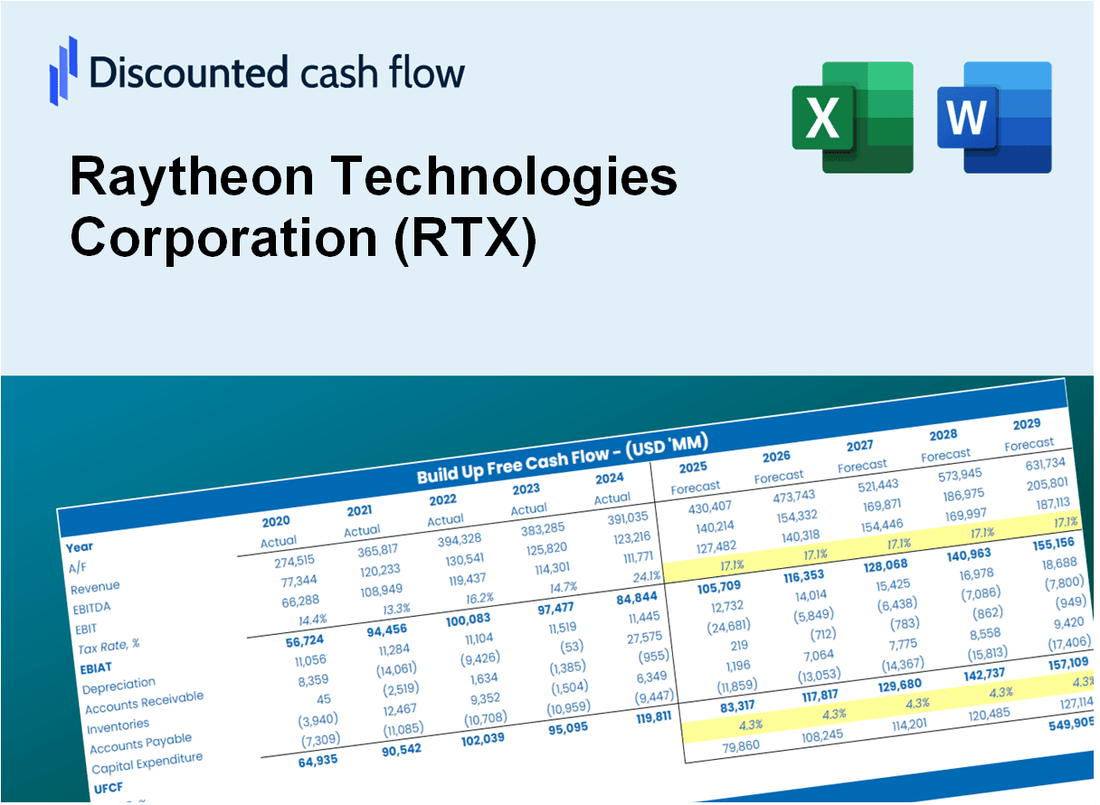
¡Obtenga información sobre su análisis de valoración de Raytheon Technologies Corporation (RTX) utilizando nuestra sofisticada calculadora DCF! Esta plantilla de Excel viene precargada con datos reales (RTX), lo que le permite ajustar los pronósticos y los supuestos para determinar con precisión el valor intrínseco de Raytheon Technologies Corporation.
Discounted Cash Flow (DCF) - (USD MM)
| Year | AY1 2020 |
AY2 2021 |
AY3 2022 |
AY4 2023 |
AY5 2024 |
FY1 2025 |
FY2 2026 |
FY3 2027 |
FY4 2028 |
FY5 2029 |
|---|---|---|---|---|---|---|---|---|---|---|
| Revenue | 56,669.0 | 64,360.0 | 67,074.0 | 68,920.0 | 80,738.0 | 88,345.2 | 96,669.1 | 105,777.4 | 115,743.8 | 126,649.3 |
| Revenue Growth, % | 0 | 13.57 | 4.22 | 2.75 | 17.15 | 9.42 | 9.42 | 9.42 | 9.42 | 9.42 |
| EBITDA | 2,947.0 | 10,556.0 | 11,174.0 | 9,374.0 | 12,164.0 | 11,825.6 | 12,939.8 | 14,159.0 | 15,493.1 | 16,952.9 |
| EBITDA, % | 5.2 | 16.4 | 16.66 | 13.6 | 15.07 | 13.39 | 13.39 | 13.39 | 13.39 | 13.39 |
| Depreciation | 3,892.0 | 4,267.0 | 3,757.0 | 3,885.0 | 4,000.0 | 5,246.0 | 5,740.3 | 6,281.1 | 6,873.0 | 7,520.5 |
| Depreciation, % | 6.87 | 6.63 | 5.6 | 5.64 | 4.95 | 5.94 | 5.94 | 5.94 | 5.94 | 5.94 |
| EBIT | -945.0 | 6,289.0 | 7,417.0 | 5,489.0 | 8,164.0 | 6,579.6 | 7,199.5 | 7,877.9 | 8,620.1 | 9,432.3 |
| EBIT, % | -1.67 | 9.77 | 11.06 | 7.96 | 10.11 | 7.45 | 7.45 | 7.45 | 7.45 | 7.45 |
| Total Cash | 8,802.0 | 7,832.0 | 6,220.0 | 6,587.0 | 5,578.0 | 9,442.5 | 10,332.2 | 11,305.7 | 12,370.9 | 13,536.5 |
| Total Cash, percent | .0 | .0 | .0 | .0 | .0 | .0 | .0 | .0 | .0 | .0 |
| Account Receivables | 19,185.0 | 21,022.0 | 20,642.0 | 22,977.0 | 25,546.0 | 28,671.9 | 31,373.4 | 34,329.4 | 37,563.9 | 41,103.2 |
| Account Receivables, % | 33.85 | 32.66 | 30.77 | 33.34 | 31.64 | 32.45 | 32.45 | 32.45 | 32.45 | 32.45 |
| Inventories | 9,411.0 | 9,178.0 | 10,617.0 | 11,777.0 | 12,768.0 | 14,064.2 | 15,389.4 | 16,839.4 | 18,426.0 | 20,162.1 |
| Inventories, % | 16.61 | 14.26 | 15.83 | 17.09 | 15.81 | 15.92 | 15.92 | 15.92 | 15.92 | 15.92 |
| Accounts Payable | 8,639.0 | 8,751.0 | 9,896.0 | 10,698.0 | 12,897.0 | 13,268.0 | 14,518.1 | 15,886.0 | 17,382.8 | 19,020.6 |
| Accounts Payable, % | 15.24 | 13.6 | 14.75 | 15.52 | 15.97 | 15.02 | 15.02 | 15.02 | 15.02 | 15.02 |
| Capital Expenditure | -1,967.0 | -2,322.0 | -2,775.0 | -3,166.0 | -2,625.0 | -3,367.9 | -3,685.2 | -4,032.5 | -4,412.4 | -4,828.1 |
| Capital Expenditure, % | -3.47 | -3.61 | -4.14 | -4.59 | -3.25 | -3.81 | -3.81 | -3.81 | -3.81 | -3.81 |
| Tax Rate, % | 22.93 | 22.93 | 22.93 | 22.93 | 22.93 | 22.93 | 22.93 | 22.93 | 22.93 | 22.93 |
| EBITAT | -1,413.3 | 4,928.1 | 6,301.5 | 4,571.8 | 6,292.4 | 5,575.4 | 6,100.7 | 6,675.5 | 7,304.5 | 7,992.7 |
| Depreciation | ||||||||||
| Changes in Account Receivables | ||||||||||
| Changes in Inventories | ||||||||||
| Changes in Accounts Payable | ||||||||||
| Capital Expenditure | ||||||||||
| UFCF | -19,445.3 | 5,381.1 | 7,369.5 | 2,597.8 | 6,306.4 | 3,402.3 | 5,379.2 | 5,886.1 | 6,440.6 | 7,047.5 |
| WACC, % | 5.59 | 5.44 | 5.49 | 5.47 | 5.43 | 5.48 | 5.48 | 5.48 | 5.48 | 5.48 |
| PV UFCF | ||||||||||
| SUM PV UFCF | 23,672.8 | |||||||||
| Long Term Growth Rate, % | 2.00 | |||||||||
| Free cash flow (T + 1) | 7,188 | |||||||||
| Terminal Value | 206,286 | |||||||||
| Present Terminal Value | 157,951 | |||||||||
| Enterprise Value | 181,624 | |||||||||
| Net Debt | 37,315 | |||||||||
| Equity Value | 144,309 | |||||||||
| Diluted Shares Outstanding, MM | 1,344 | |||||||||
| Equity Value Per Share | 107.40 |
What You Will Get
- Real RTX Financial Data: Pre-filled with Raytheon Technologies' historical and projected data for precise analysis.
- Fully Editable Template: Modify key inputs like revenue growth, WACC, and EBITDA % with ease.
- Automatic Calculations: See RTX's intrinsic value update instantly based on your changes.
- Professional Valuation Tool: Designed for investors, analysts, and consultants seeking accurate DCF results.
- User-Friendly Design: Simple structure and clear instructions for all experience levels.
Key Features
- Comprehensive Historical Data: Access Raytheon Technologies Corporation’s (RTX) past financial statements and pre-filled projections.
- Customizable Parameters: Modify WACC, tax rates, revenue growth, and EBITDA margins to fit your analysis.
- Real-Time Valuation: Instantly view the recalculated intrinsic value of Raytheon Technologies Corporation (RTX).
- Intuitive Visualizations: Dashboard charts provide clear displays of valuation outcomes and essential metrics.
- Designed for Precision: A reliable tool tailored for analysts, investors, and finance professionals.
How It Works
- Step 1: Download the prebuilt Excel template featuring Raytheon Technologies Corporation's (RTX) data.
- Step 2: Navigate through the pre-filled sheets to familiarize yourself with the essential metrics.
- Step 3: Modify forecasts and assumptions in the editable yellow cells (WACC, growth, margins).
- Step 4: Instantly see the updated results, including Raytheon Technologies Corporation's (RTX) intrinsic value.
- Step 5: Utilize the outputs to make informed investment decisions or create detailed reports.
Why Choose This Calculator for Raytheon Technologies Corporation (RTX)?
- Designed for Experts: A sophisticated tool utilized by analysts, CFOs, and industry consultants.
- Accurate Data: Raytheon’s historical and projected financials preloaded for precision.
- Scenario Analysis: Effortlessly simulate various forecasts and assumptions.
- Comprehensive Outputs: Automatically calculates intrinsic value, NPV, and essential metrics.
- User-Friendly: Step-by-step guidance ensures a smooth experience.
Who Should Use Raytheon Technologies Corporation (RTX)?
- Investors: Gain insights and make informed decisions with a comprehensive analysis of Raytheon Technologies Corporation (RTX).
- Financial Analysts: Enhance your workflow with detailed financial models tailored for Raytheon Technologies Corporation (RTX).
- Consultants: Easily customize reports and presentations focused on Raytheon Technologies Corporation (RTX) for your clients.
- Defense and Aerospace Enthusiasts: Explore the intricacies of the industry through the lens of Raytheon Technologies Corporation (RTX).
- Educators and Students: Utilize real-world case studies from Raytheon Technologies Corporation (RTX) to enrich finance and engineering curricula.
What the Template Contains
- Preloaded RTX Data: Historical and projected financial data, including revenue, EBIT, and capital expenditures.
- DCF and WACC Models: Professional-grade sheets for calculating intrinsic value and Weighted Average Cost of Capital.
- Editable Inputs: Yellow-highlighted cells for adjusting revenue growth, tax rates, and discount rates.
- Financial Statements: Comprehensive annual and quarterly financials for deeper analysis.
- Key Ratios: Profitability, leverage, and efficiency ratios to evaluate performance.
- Dashboard and Charts: Visual summaries of valuation outcomes and assumptions.
Disclaimer
All information, articles, and product details provided on this website are for general informational and educational purposes only. We do not claim any ownership over, nor do we intend to infringe upon, any trademarks, copyrights, logos, brand names, or other intellectual property mentioned or depicted on this site. Such intellectual property remains the property of its respective owners, and any references here are made solely for identification or informational purposes, without implying any affiliation, endorsement, or partnership.
We make no representations or warranties, express or implied, regarding the accuracy, completeness, or suitability of any content or products presented. Nothing on this website should be construed as legal, tax, investment, financial, medical, or other professional advice. In addition, no part of this site—including articles or product references—constitutes a solicitation, recommendation, endorsement, advertisement, or offer to buy or sell any securities, franchises, or other financial instruments, particularly in jurisdictions where such activity would be unlawful.
All content is of a general nature and may not address the specific circumstances of any individual or entity. It is not a substitute for professional advice or services. Any actions you take based on the information provided here are strictly at your own risk. You accept full responsibility for any decisions or outcomes arising from your use of this website and agree to release us from any liability in connection with your use of, or reliance upon, the content or products found herein.