
|
Rubis (Rui.PA) DCF Valoración |
Completamente Editable: Adáptelo A Sus Necesidades En Excel O Sheets
Diseño Profesional: Plantillas Confiables Y Estándares De La Industria
Predeterminadas Para Un Uso Rápido Y Eficiente
Compatible con MAC / PC, completamente desbloqueado
No Se Necesita Experiencia; Fáciles De Seguir
Rubis (RUI.PA) Bundle
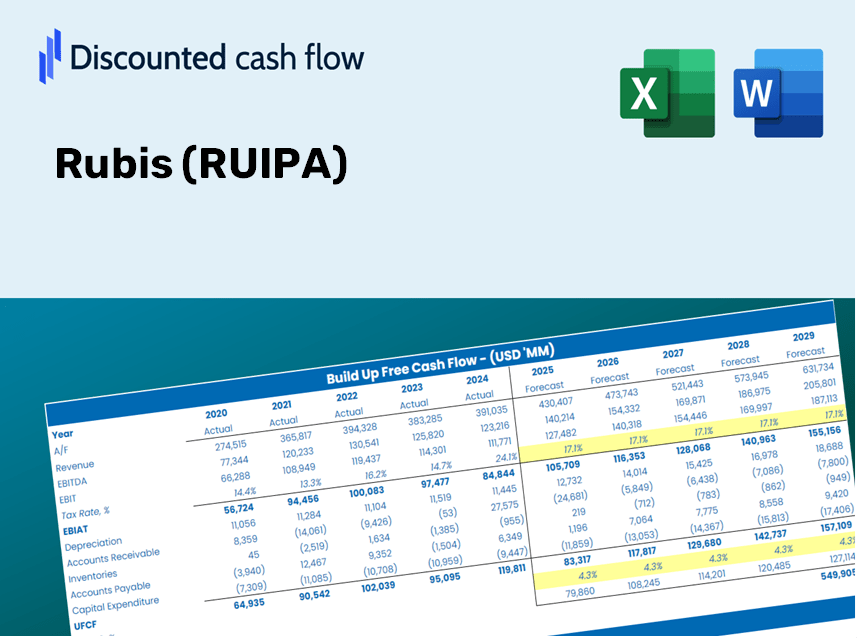
¡Agilice su análisis y mejore la precisión con nuestra calculadora DCF (Ruipa)! Utilizando datos reales de Rubis y supuestos personalizables, esta herramienta le permite pronosticar, analizar y valorar Rubis como un inversor experimentado.
What You Will Gain
- Accurate RUIS Financials: Access to historical and projected data for precise evaluations.
- Customizable Inputs: Adjust WACC, tax rates, revenue growth, and capital expenditures as needed.
- Automated Calculations: Intrinsic value and NPV computed in real-time.
- Scenario Testing: Analyze various scenarios to assess Rubis's future performance.
- Clear and User-Friendly Design: Crafted for professionals while remaining accessible to newcomers.
Key Features
- 🔍 Real-Life RUB Financials: Pre-filled historical and projected data for Rubis (RUIPA).
- ✏️ Fully Customizable Inputs: Modify all essential parameters (yellow cells) such as WACC, growth %, and tax rates.
- 📊 Professional DCF Valuation: Integrated formulas to compute Rubis’s intrinsic value using the Discounted Cash Flow method.
- ⚡ Instant Results: Immediately visualize Rubis’s valuation after making adjustments.
- Scenario Analysis: Evaluate and compare results for different financial assumptions side-by-side.
How It Functions
- Download: Obtain the pre-filled Excel spreadsheet containing Rubis’ financial data.
- Customize: Modify projections, such as revenue growth, EBITDA %, and WACC.
- Update Automatically: The intrinsic value and NPV calculations refresh in real-time.
- Test Scenarios: Develop several forecasts and instantly compare results.
- Make Decisions: Utilize the valuation findings to inform your investment strategy with Rubis (RUIPA).
Why Opt for This Calculator?
- All-in-One Solution: Features DCF, WACC, and financial ratio analyses bundled together.
- Tailored Inputs: Modify the yellow-highlighted cells to explore different scenarios.
- In-Depth Analysis: Automatically computes Rubis’s intrinsic value and Net Present Value.
- Preloaded Information: Historical and projected data provide reliable starting metrics.
- Expert Level: Perfect for financial analysts, investors, and business consultants focusing on Rubis (RUIPA).
Who Can Benefit from Rubis (RUIPA)?
- Investors: Utilize a sophisticated valuation tool to make informed investment choices.
- Financial Analysts: Streamline your workflow with a customizable DCF model at your fingertips.
- Consultants: Effortlessly modify the template for impactful client presentations or comprehensive reports.
- Finance Enthusiasts: Enhance your grasp of valuation methods through practical, real-world scenarios.
- Educators and Students: Leverage this resource as an effective learning aid in finance courses.
Contents of the Template
- Pre-Filled DCF Model: Rubis’ financial data preloaded for immediate application.
- WACC Calculator: Comprehensive calculations for the Weighted Average Cost of Capital.
- Financial Ratios: Assess Rubis’ profitability, leverage, and operational efficiency.
- Editable Inputs: Adjust assumptions such as growth rates, margins, and CAPEX to tailor your analyses.
- Financial Statements: Access annual and quarterly reports for in-depth examination.
- Interactive Dashboard: Effortlessly visualize essential valuation metrics and outcomes.
Disclaimer
All information, articles, and product details provided on this website are for general informational and educational purposes only. We do not claim any ownership over, nor do we intend to infringe upon, any trademarks, copyrights, logos, brand names, or other intellectual property mentioned or depicted on this site. Such intellectual property remains the property of its respective owners, and any references here are made solely for identification or informational purposes, without implying any affiliation, endorsement, or partnership.
We make no representations or warranties, express or implied, regarding the accuracy, completeness, or suitability of any content or products presented. Nothing on this website should be construed as legal, tax, investment, financial, medical, or other professional advice. In addition, no part of this site—including articles or product references—constitutes a solicitation, recommendation, endorsement, advertisement, or offer to buy or sell any securities, franchises, or other financial instruments, particularly in jurisdictions where such activity would be unlawful.
All content is of a general nature and may not address the specific circumstances of any individual or entity. It is not a substitute for professional advice or services. Any actions you take based on the information provided here are strictly at your own risk. You accept full responsibility for any decisions or outcomes arising from your use of this website and agree to release us from any liability in connection with your use of, or reliance upon, the content or products found herein.