
|
Valoración de DCF de Renewi PLC (RWI.AS) |
Completamente Editable: Adáptelo A Sus Necesidades En Excel O Sheets
Diseño Profesional: Plantillas Confiables Y Estándares De La Industria
Predeterminadas Para Un Uso Rápido Y Eficiente
Compatible con MAC / PC, completamente desbloqueado
No Se Necesita Experiencia; Fáciles De Seguir
Renewi plc (RWI.AS) Bundle
Ya sea que sea un inversor o analista, esta calculadora DCF de Renewi PLC (RWIAS) es su herramienta esencial para una valoración precisa. Cargados con datos reales de Renewi PLC, puede ajustar previsiones y observar los efectos en tiempo real.
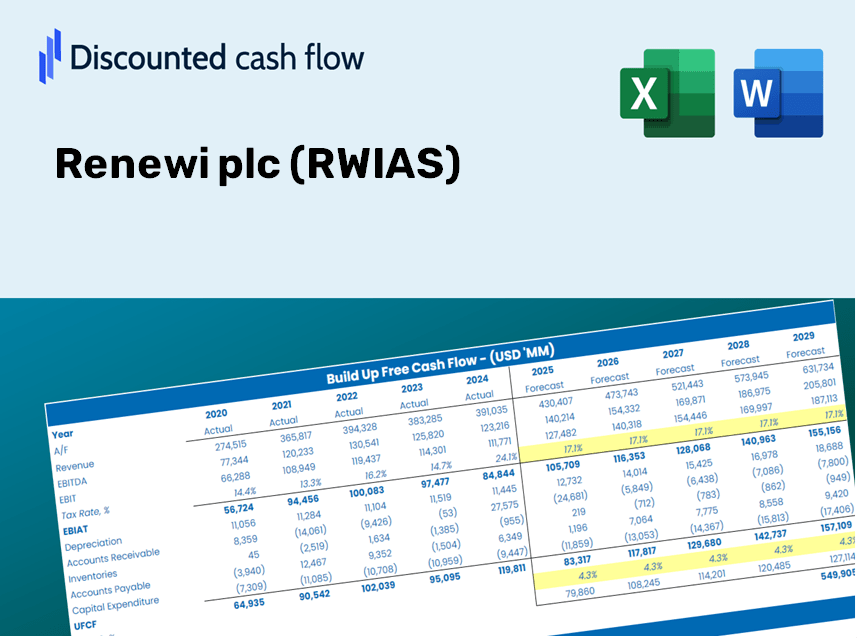
Discounted Cash Flow (DCF) - (USD MM)
| Year | AY1 2019 |
AY2 2020 |
AY3 2021 |
AY4 2022 |
AY5 2023 |
FY1 2024 |
FY2 2025 |
FY3 2026 |
FY4 2027 |
FY5 2028 |
|---|---|---|---|---|---|---|---|---|---|---|
| Revenue | 1,775.4 | 1,693.6 | 1,869.2 | 1,892.3 | 1,689.2 | 1,673.4 | 1,657.8 | 1,642.3 | 1,627.0 | 1,611.8 |
| Revenue Growth, % | 0 | -4.61 | 10.37 | 1.24 | -10.73 | -0.93403 | -0.93403 | -0.93403 | -0.93403 | -0.93403 |
| EBITDA | 111.6 | 187.8 | 263.5 | 268.4 | 227.6 | 197.9 | 196.0 | 194.2 | 192.4 | 190.6 |
| EBITDA, % | 6.29 | 11.09 | 14.1 | 14.18 | 13.47 | 11.83 | 11.83 | 11.83 | 11.83 | 11.83 |
| Depreciation | 130.4 | 142.0 | 131.3 | 127.6 | 133.8 | 125.2 | 124.1 | 122.9 | 121.8 | 120.6 |
| Depreciation, % | 7.34 | 8.38 | 7.02 | 6.74 | 7.92 | 7.48 | 7.48 | 7.48 | 7.48 | 7.48 |
| EBIT | -18.8 | 45.8 | 132.2 | 140.8 | 93.8 | 72.7 | 72.0 | 71.3 | 70.6 | 70.0 |
| EBIT, % | -1.06 | 2.7 | 7.07 | 7.44 | 5.55 | 4.34 | 4.34 | 4.34 | 4.34 | 4.34 |
| Total Cash | 202.6 | 60.8 | 53.6 | 54.6 | 79.0 | 85.1 | 84.3 | 83.5 | 82.8 | 82.0 |
| Total Cash, percent | .0 | .0 | .0 | .0 | .0 | .0 | .0 | .0 | .0 | .0 |
| Account Receivables | 174.0 | 135.8 | 159.5 | 178.2 | 234.9 | 166.3 | 164.7 | 163.2 | 161.6 | 160.1 |
| Account Receivables, % | 9.8 | 8.02 | 8.53 | 9.42 | 13.91 | 9.94 | 9.94 | 9.94 | 9.94 | 9.94 |
| Inventories | 20.7 | 20.6 | 22.5 | 25.2 | 23.4 | 21.1 | 20.9 | 20.7 | 20.5 | 20.3 |
| Inventories, % | 1.17 | 1.22 | 1.2 | 1.33 | 1.39 | 1.26 | 1.26 | 1.26 | 1.26 | 1.26 |
| Accounts Payable | 183.5 | 136.8 | 117.3 | 121.2 | 145.5 | 132.9 | 131.7 | 130.4 | 129.2 | 128.0 |
| Accounts Payable, % | 10.34 | 8.08 | 6.28 | 6.4 | 8.61 | 7.94 | 7.94 | 7.94 | 7.94 | 7.94 |
| Capital Expenditure | -80.4 | -58.0 | -77.6 | -115.0 | -99.4 | -80.5 | -79.8 | -79.0 | -78.3 | -77.6 |
| Capital Expenditure, % | -4.53 | -3.42 | -4.15 | -6.08 | -5.88 | -4.81 | -4.81 | -4.81 | -4.81 | -4.81 |
| Tax Rate, % | 157.28 | 157.28 | 157.28 | 157.28 | 157.28 | 157.28 | 157.28 | 157.28 | 157.28 | 157.28 |
| EBITAT | -19.4 | 23.5 | 102.9 | 95.1 | -53.7 | 43.1 | 42.7 | 42.3 | 41.9 | 41.5 |
| Depreciation | ||||||||||
| Changes in Account Receivables | ||||||||||
| Changes in Inventories | ||||||||||
| Changes in Accounts Payable | ||||||||||
| Capital Expenditure | ||||||||||
| UFCF | 19.4 | 99.1 | 111.5 | 90.2 | -49.9 | 146.2 | 87.5 | 86.7 | 85.9 | 85.1 |
| WACC, % | 9.2 | 7.04 | 8.21 | 7.76 | 4.76 | 7.39 | 7.39 | 7.39 | 7.39 | 7.39 |
| PV UFCF | ||||||||||
| SUM PV UFCF | 406.1 | |||||||||
| Long Term Growth Rate, % | 2.00 | |||||||||
| Free cash flow (T + 1) | 87 | |||||||||
| Terminal Value | 1,610 | |||||||||
| Present Terminal Value | 1,127 | |||||||||
| Enterprise Value | 1,533 | |||||||||
| Net Debt | 616 | |||||||||
| Equity Value | 917 | |||||||||
| Diluted Shares Outstanding, MM | 80 | |||||||||
| Equity Value Per Share | 11.50 |
What You'll Receive
- Authentic RWIAS Financial Data: Pre-loaded with Renewi plc’s historical and projected figures for accurate analysis.
- Completely Customizable Template: Easily adjust essential inputs such as revenue growth, WACC, and EBITDA %.
- Instant Calculations: Watch the intrinsic value of Renewi plc update in real-time as you make adjustments.
- Professional Valuation Tool: Crafted for investors, analysts, and consultants in search of reliable DCF results.
- Intuitive User Interface: Designed with a straightforward layout and easy-to-follow instructions for users of all skill levels.
Key Features
- Customizable Forecast Inputs: Adjust essential factors such as revenue growth, EBITDA %, and capital investments.
- Instant DCF Valuation: Automatically computes intrinsic value, NPV, and additional metrics in real time.
- High-Precision Accuracy: Leverages Renewi plc’s (RWIAS) actual financial data for dependable valuation results.
- Seamless Scenario Analysis: Evaluate various assumptions and effortlessly compare results.
- Efficiency Booster: Remove the burden of creating intricate valuation models from the ground up.
How It Functions
- Download: Obtain the pre-configured Excel file featuring Renewi plc's (RWIAS) financial data.
- Customize: Modify projections, such as revenue growth, EBITDA percentage, and WACC.
- Update Automatically: The intrinsic value and NPV calculations refresh in real-time.
- Test Scenarios: Develop various forecasts and analyze results immediately.
- Make Decisions: Leverage the valuation findings to inform your investment approach.
Why Choose This Calculator for Renewi plc (RWIAS)?
- User-Friendly Interface: Tailored for both novices and seasoned professionals.
- Customizable Inputs: Adjust parameters effortlessly to suit your analysis needs.
- Real-Time Valuation: Monitor immediate impacts on Renewi's valuation as you tweak inputs.
- Pre-Loaded Data: Comes equipped with Renewi's current financial figures for efficient assessment.
- Endorsed by Experts: Favored by investors and analysts for making well-informed choices.
Who Should Use This Product?
- Individual Investors: Make informed choices regarding the purchase or sale of Renewi plc (RWIAS) shares.
- Financial Analysts: Enhance valuation methodologies with comprehensive financial models at your fingertips.
- Consultants: Provide clients with expert valuation insights on Renewi plc (RWIAS) swiftly and accurately.
- Business Owners: Gain insights into the valuation of major companies like Renewi plc (RWIAS) to inform your own business strategies.
- Finance Students: Explore valuation practices through real-world data and case studies involving Renewi plc (RWIAS).
What the Template Contains
- Historical Data: Features Renewi plc's past financial performance and foundational forecasts.
- DCF and Levered DCF Models: Comprehensive templates for assessing Renewi plc's intrinsic value.
- WACC Sheet: Pre-calculated figures for the Weighted Average Cost of Capital.
- Editable Inputs: Adjust key parameters such as growth rates, EBITDA percentages, and CAPEX assumptions.
- Quarterly and Annual Statements: An extensive overview of Renewi plc's financials.
- Interactive Dashboard: Dynamically visualize valuation results and future projections.
Disclaimer
All information, articles, and product details provided on this website are for general informational and educational purposes only. We do not claim any ownership over, nor do we intend to infringe upon, any trademarks, copyrights, logos, brand names, or other intellectual property mentioned or depicted on this site. Such intellectual property remains the property of its respective owners, and any references here are made solely for identification or informational purposes, without implying any affiliation, endorsement, or partnership.
We make no representations or warranties, express or implied, regarding the accuracy, completeness, or suitability of any content or products presented. Nothing on this website should be construed as legal, tax, investment, financial, medical, or other professional advice. In addition, no part of this site—including articles or product references—constitutes a solicitation, recommendation, endorsement, advertisement, or offer to buy or sell any securities, franchises, or other financial instruments, particularly in jurisdictions where such activity would be unlawful.
All content is of a general nature and may not address the specific circumstances of any individual or entity. It is not a substitute for professional advice or services. Any actions you take based on the information provided here are strictly at your own risk. You accept full responsibility for any decisions or outcomes arising from your use of this website and agree to release us from any liability in connection with your use of, or reliance upon, the content or products found herein.