
|
Valoración DCF de Rayonier Inc. (RYN) |
Completamente Editable: Adáptelo A Sus Necesidades En Excel O Sheets
Diseño Profesional: Plantillas Confiables Y Estándares De La Industria
Predeterminadas Para Un Uso Rápido Y Eficiente
Compatible con MAC / PC, completamente desbloqueado
No Se Necesita Experiencia; Fáciles De Seguir
Rayonier Inc. (RYN) Bundle
¿Busca evaluar el valor intrínseco de Rayonier Inc.? Nuestra calculadora Ryn DCF integra datos del mundo real con extensas características de personalización, lo que le permite ajustar los pronósticos y mejorar sus decisiones de inversión.
What You Will Get
- Editable Forecast Inputs: Easily modify assumptions (growth %, margins, WACC) to explore various scenarios.
- Real-World Data: Rayonier Inc.'s (RYN) financial data pre-loaded to expedite your analysis.
- Automatic DCF Outputs: The template computes Net Present Value (NPV) and intrinsic value automatically.
- Customizable and Professional: A sleek Excel model that adjusts to your valuation requirements.
- Built for Analysts and Investors: Perfect for testing projections, validating strategies, and enhancing efficiency.
Key Features
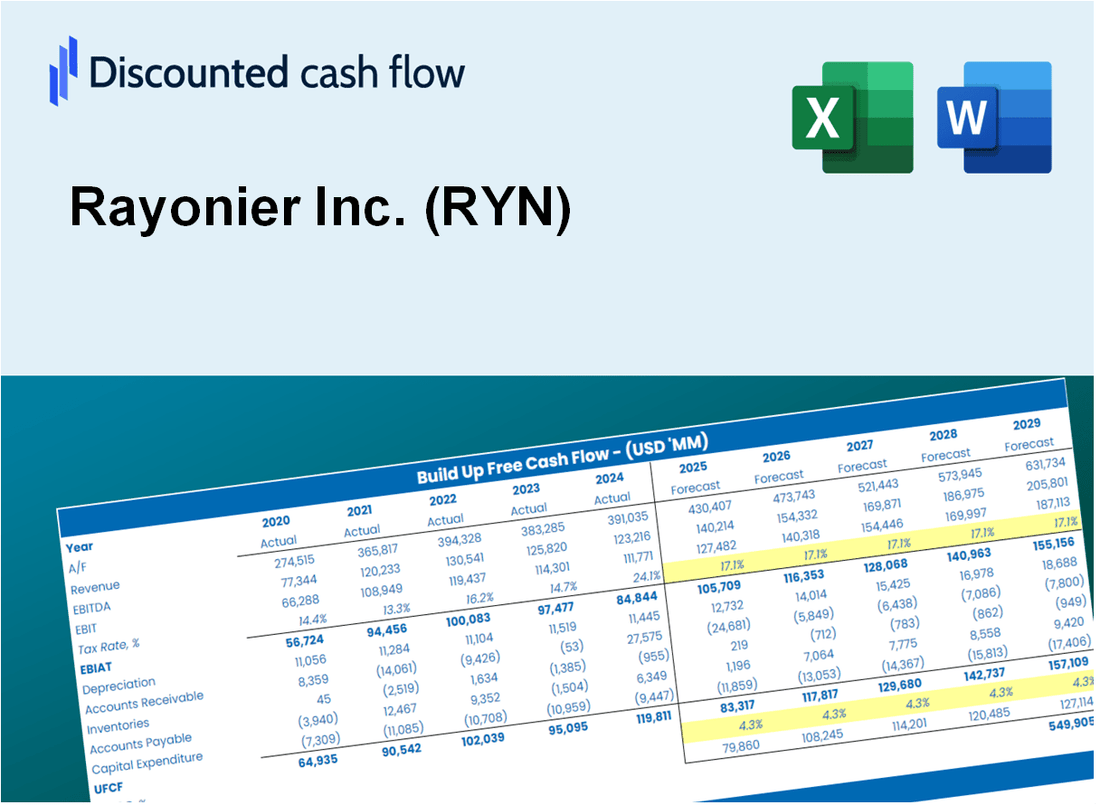
- Comprehensive DCF Calculator: Offers detailed unlevered and levered DCF valuation models tailored for Rayonier Inc. (RYN).
- WACC Calculator: Features a pre-built Weighted Average Cost of Capital sheet with customizable parameters specific to Rayonier Inc. (RYN).
- Customizable Forecast Assumptions: Adjust growth rates, capital expenditures, and discount rates to fit Rayonier Inc. (RYN) projections.
- Integrated Financial Ratios: Evaluate profitability, leverage, and efficiency ratios relevant to Rayonier Inc. (RYN).
- Interactive Dashboard and Charts: Visual representations summarize key valuation metrics for straightforward analysis of Rayonier Inc. (RYN).
How It Works
- Step 1: Download the Excel file.
- Step 2: Review pre-entered Rayonier Inc. (RYN) data (historical and projected).
- Step 3: Adjust key assumptions (yellow cells) based on your analysis.
- Step 4: View automatic recalculations for Rayonier Inc.'s (RYN) intrinsic value.
- Step 5: Use the outputs for investment decisions or reporting.
Why Choose This Calculator for Rayonier Inc. (RYN)?
- Precise Information: Up-to-date Rayonier financials guarantee trustworthy valuation outcomes.
- Flexible Options: Modify essential factors such as growth rates, WACC, and tax rates to align with your forecasts.
- Efficient: Built-in calculations save you the hassle of starting from ground zero.
- Expert-Level Tool: Tailored for investors, analysts, and industry professionals.
- Easy to Use: User-friendly design and clear, step-by-step guidance cater to all experience levels.
Who Should Use Rayonier Inc. (RYN)?
- Environmental Science Students: Explore sustainable forestry practices and their impact on valuation.
- Researchers: Integrate real-world data on timberland management into studies or projects.
- Investors: Evaluate your investment strategies and analyze the market performance of Rayonier Inc. (RYN).
- Financial Analysts: Enhance your analysis with a tailored DCF model specific to the forestry sector.
- Real Estate Developers: Understand how land valuation and timber resources affect property investments.
What the Template Contains
- Pre-Filled Data: Includes Rayonier Inc.'s historical financials and forecasts.
- Discounted Cash Flow Model: Editable DCF valuation model with automatic calculations.
- Weighted Average Cost of Capital (WACC): A dedicated sheet for calculating WACC based on custom inputs.
- Key Financial Ratios: Analyze Rayonier Inc.'s profitability, efficiency, and leverage.
- Customizable Inputs: Edit revenue growth, margins, and tax rates with ease.
- Clear Dashboard: Charts and tables summarizing key valuation results.
Disclaimer
All information, articles, and product details provided on this website are for general informational and educational purposes only. We do not claim any ownership over, nor do we intend to infringe upon, any trademarks, copyrights, logos, brand names, or other intellectual property mentioned or depicted on this site. Such intellectual property remains the property of its respective owners, and any references here are made solely for identification or informational purposes, without implying any affiliation, endorsement, or partnership.
We make no representations or warranties, express or implied, regarding the accuracy, completeness, or suitability of any content or products presented. Nothing on this website should be construed as legal, tax, investment, financial, medical, or other professional advice. In addition, no part of this site—including articles or product references—constitutes a solicitation, recommendation, endorsement, advertisement, or offer to buy or sell any securities, franchises, or other financial instruments, particularly in jurisdictions where such activity would be unlawful.
All content is of a general nature and may not address the specific circumstances of any individual or entity. It is not a substitute for professional advice or services. Any actions you take based on the information provided here are strictly at your own risk. You accept full responsibility for any decisions or outcomes arising from your use of this website and agree to release us from any liability in connection with your use of, or reliance upon, the content or products found herein.