
|
Autoridad de acero de India Limited (Sail.NS) DCF Valoración |
Completamente Editable: Adáptelo A Sus Necesidades En Excel O Sheets
Diseño Profesional: Plantillas Confiables Y Estándares De La Industria
Predeterminadas Para Un Uso Rápido Y Eficiente
Compatible con MAC / PC, completamente desbloqueado
No Se Necesita Experiencia; Fáciles De Seguir
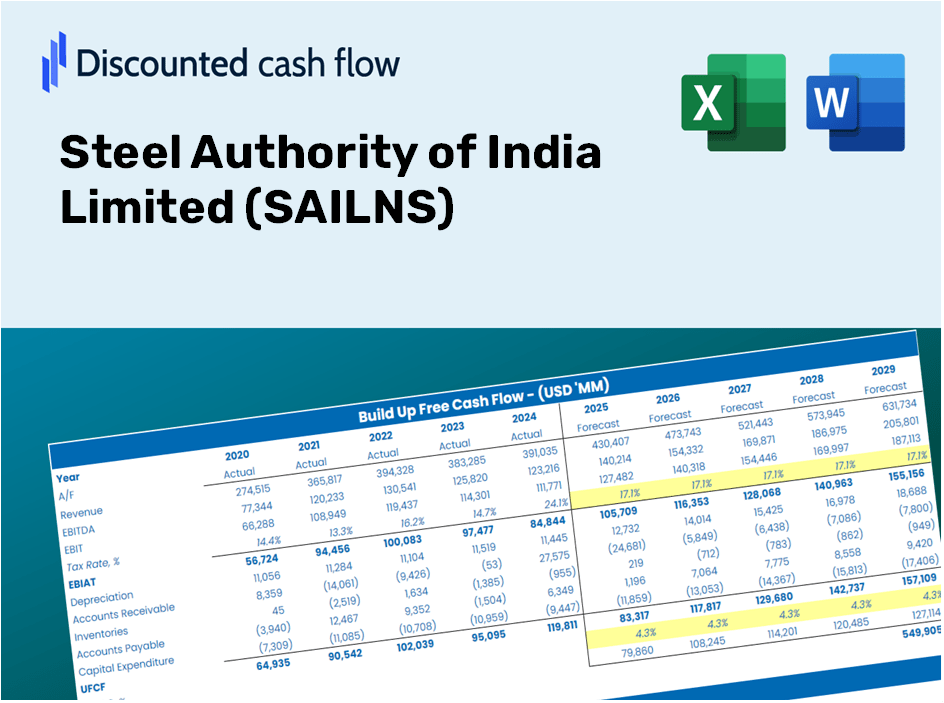
Steel Authority of India Limited (SAIL.NS) Bundle
¡Evalúe la perspectiva financiera de la Autoridad de Acero de India Limited (SAILNS) como un experto! Esta calculadora DCF (SAILNS) proporciona datos financieros preconidos junto con la flexibilidad para personalizar el crecimiento de los ingresos, WACC, los márgenes y otros supuestos cruciales para alinearse con sus proyecciones.
Discounted Cash Flow (DCF) - (USD MM)
| Year | AY1 2021 |
AY2 2022 |
AY3 2023 |
AY4 2024 |
AY5 2025 |
FY1 2026 |
FY2 2027 |
FY3 2028 |
FY4 2029 |
FY5 2030 |
|---|---|---|---|---|---|---|---|---|---|---|
| Revenue | 691,136.1 | 1,034,768.4 | 1,044,477.2 | 1,053,783.3 | 1,024,790.6 | 1,065,192.5 | 1,107,187.3 | 1,150,837.7 | 1,196,209.0 | 1,243,369.0 |
| Revenue Growth, % | 0 | 49.72 | 0.93826 | 0.89098 | -2.75 | 3.94 | 3.94 | 3.94 | 3.94 | 3.94 |
| EBITDA | 140,981.7 | 217,556.7 | 92,477.5 | 117,543.6 | 112,086.0 | 154,174.0 | 160,252.2 | 166,570.1 | 173,137.0 | 179,962.9 |
| EBITDA, % | 20.4 | 21.02 | 8.85 | 11.15 | 10.94 | 14.47 | 14.47 | 14.47 | 14.47 | 14.47 |
| Depreciation | 41,027.8 | 42,749.9 | 49,635.1 | 52,783.3 | 56,506.8 | 53,989.7 | 56,118.2 | 58,330.7 | 60,630.3 | 63,020.7 |
| Depreciation, % | 5.94 | 4.13 | 4.75 | 5.01 | 5.51 | 5.07 | 5.07 | 5.07 | 5.07 | 5.07 |
| EBIT | 99,953.9 | 174,806.8 | 42,842.4 | 64,760.3 | 55,579.2 | 100,184.3 | 104,134.0 | 108,239.4 | 112,506.7 | 116,942.2 |
| EBIT, % | 14.46 | 16.89 | 4.1 | 6.15 | 5.42 | 9.41 | 9.41 | 9.41 | 9.41 | 9.41 |
| Total Cash | 5,844.0 | 1,979.9 | 1,591.3 | 6,729.5 | 3,474.8 | 4,616.4 | 4,798.4 | 4,987.6 | 5,184.2 | 5,388.6 |
| Total Cash, percent | .0 | .0 | .0 | .0 | .0 | .0 | .0 | .0 | .0 | .0 |
| Account Receivables | 81,685.4 | 66,518.9 | 53,899.7 | 83,553.7 | 76,325.4 | 82,626.3 | 85,883.8 | 89,269.7 | 92,789.1 | 96,447.3 |
| Account Receivables, % | 11.82 | 6.43 | 5.16 | 7.93 | 7.45 | 7.76 | 7.76 | 7.76 | 7.76 | 7.76 |
| Inventories | 153,341.7 | 195,682.8 | 277,649.0 | 327,214.5 | 291,514.5 | 270,937.9 | 281,619.6 | 292,722.3 | 304,262.7 | 316,258.2 |
| Inventories, % | 22.19 | 18.91 | 26.58 | 31.05 | 28.45 | 25.44 | 25.44 | 25.44 | 25.44 | 25.44 |
| Accounts Payable | 80,426.5 | 169,218.3 | 143,417.0 | 153,323.9 | 105,039.9 | 141,715.0 | 147,302.0 | 153,109.4 | 159,145.6 | 165,419.9 |
| Accounts Payable, % | 11.64 | 16.35 | 13.73 | 14.55 | 10.25 | 13.3 | 13.3 | 13.3 | 13.3 | 13.3 |
| Capital Expenditure | -35,549.7 | -36,654.9 | -39,216.4 | -47,106.9 | -62,211.5 | -48,959.6 | -50,889.8 | -52,896.1 | -54,981.5 | -57,149.1 |
| Capital Expenditure, % | -5.14 | -3.54 | -3.75 | -4.47 | -6.07 | -4.6 | -4.6 | -4.6 | -4.6 | -4.6 |
| Tax Rate, % | 27.06 | 27.06 | 27.06 | 27.06 | 27.06 | 27.06 | 27.06 | 27.06 | 27.06 | 27.06 |
| EBITAT | 57,541.2 | 131,368.7 | 32,238.4 | 48,894.1 | 40,542.1 | 71,413.8 | 74,229.3 | 77,155.7 | 80,197.6 | 83,359.3 |
| Depreciation | ||||||||||
| Changes in Account Receivables | ||||||||||
| Changes in Inventories | ||||||||||
| Changes in Accounts Payable | ||||||||||
| Capital Expenditure | ||||||||||
| UFCF | -91,581.3 | 199,080.9 | -52,491.2 | -14,742.1 | 29,481.7 | 127,394.7 | 71,105.7 | 73,909.0 | 76,822.8 | 79,851.5 |
| WACC, % | 7.34 | 7.86 | 7.86 | 7.87 | 7.79 | 7.74 | 7.74 | 7.74 | 7.74 | 7.74 |
| PV UFCF | ||||||||||
| SUM PV UFCF | 350,595.6 | |||||||||
| Long Term Growth Rate, % | 3.50 | |||||||||
| Free cash flow (T + 1) | 82,646 | |||||||||
| Terminal Value | 1,948,182 | |||||||||
| Present Terminal Value | 1,341,837 | |||||||||
| Enterprise Value | 1,692,433 | |||||||||
| Net Debt | 359,671 | |||||||||
| Equity Value | 1,332,762 | |||||||||
| Diluted Shares Outstanding, MM | 4,132 | |||||||||
| Equity Value Per Share | 322.54 |
What You Will Receive
- Authentic SAIL Data: Comprehensive financials – from revenue to EBIT – based on actual and projected figures.
- Complete Customization: Modify all key parameters (yellow cells) such as WACC, growth %, and tax rates.
- Real-Time Valuation Adjustments: Automated recalculations to assess the effect of changes on SAILNS’s fair value.
- Flexible Excel Template: Designed for quick alterations, scenario analysis, and thorough projections.
- Efficient and Precise: Eliminate the need to build models from the ground up while ensuring accuracy and adaptability.
Key Features
- Advanced DCF Calculator: Features comprehensive unlevered and levered DCF valuation models tailored for Steel Authority of India Limited (SAILNS).
- WACC Calculator: Pre-configured Weighted Average Cost of Capital sheet with adjustable inputs for precise calculations.
- Customizable Forecast Assumptions: Easily update growth rates, capital expenditures, and discount rates to suit your analysis.
- Integrated Financial Ratios: Evaluate profitability, leverage, and efficiency ratios specific to Steel Authority of India Limited (SAILNS).
- Dashboard and Charts: Visual representations highlight essential valuation metrics for streamlined analysis.
How It Works
- Step 1: Download the Excel file.
- Step 2: Review the pre-filled data for Steel Authority of India Limited (SAILNS), including historical and projected figures.
- Step 3: Modify key assumptions (highlighted in yellow) according to your analysis.
- Step 4: Observe the automatic updates reflecting the intrinsic value of Steel Authority of India Limited (SAILNS).
- Step 5: Utilize the results for investment decisions or reporting purposes.
Why Opt for the SAILNS Calculator?
- Save Time: Get started immediately with a pre-built DCF model – no setup required.
- Enhance Accuracy: Use dependable financial data and formulas to minimize valuation errors.
- Completely Customizable: Adjust the model to align with your specific assumptions and forecasts.
- User-Friendly: Intuitive charts and outputs simplify the analysis of results.
- Preferred by Professionals: Crafted for users who prioritize precision and ease of use.
Who Can Benefit from This Product?
- Finance Students: Discover valuation techniques and practice applying them with real-world data.
- Academics: Integrate industry-standard models into your curriculum or research projects.
- Investors: Evaluate your investment hypotheses and scrutinize valuation outcomes for Steel Authority of India Limited (SAILNS).
- Analysts: Enhance your efficiency with a customizable, ready-to-use DCF model.
- Small Business Owners: Learn how major public enterprises like Steel Authority of India Limited (SAILNS) are assessed and valued.
Contents of the Template
- Preloaded SAILNS Data: Historical and forecasted financial information, including revenue, EBIT, and capital expenditures.
- DCF and WACC Models: Professional-grade worksheets for assessing intrinsic value and calculating the Weighted Average Cost of Capital.
- Editable Inputs: Yellow-highlighted fields for modifying revenue growth, tax rates, and discount rates.
- Financial Statements: Detailed annual and quarterly financial reports for in-depth analysis.
- Key Ratios: Metrics on profitability, leverage, and efficiency to assess performance.
- Dashboard and Charts: Visual representations of valuation results and underlying assumptions.
Disclaimer
All information, articles, and product details provided on this website are for general informational and educational purposes only. We do not claim any ownership over, nor do we intend to infringe upon, any trademarks, copyrights, logos, brand names, or other intellectual property mentioned or depicted on this site. Such intellectual property remains the property of its respective owners, and any references here are made solely for identification or informational purposes, without implying any affiliation, endorsement, or partnership.
We make no representations or warranties, express or implied, regarding the accuracy, completeness, or suitability of any content or products presented. Nothing on this website should be construed as legal, tax, investment, financial, medical, or other professional advice. In addition, no part of this site—including articles or product references—constitutes a solicitation, recommendation, endorsement, advertisement, or offer to buy or sell any securities, franchises, or other financial instruments, particularly in jurisdictions where such activity would be unlawful.
All content is of a general nature and may not address the specific circumstances of any individual or entity. It is not a substitute for professional advice or services. Any actions you take based on the information provided here are strictly at your own risk. You accept full responsibility for any decisions or outcomes arising from your use of this website and agree to release us from any liability in connection with your use of, or reliance upon, the content or products found herein.