
|
Valoración DCF de SharpLink Gaming Ltd. (SBET) |
Completamente Editable: Adáptelo A Sus Necesidades En Excel O Sheets
Diseño Profesional: Plantillas Confiables Y Estándares De La Industria
Predeterminadas Para Un Uso Rápido Y Eficiente
Compatible con MAC / PC, completamente desbloqueado
No Se Necesita Experiencia; Fáciles De Seguir
SharpLink Gaming Ltd. (SBET) Bundle
Ya sea que sea un inversionista o analista, esta calculadora DCF de Sharplink Gaming Ltd. (SBET) es su recurso para una valoración precisa. Precedidos con datos reales de Sharplink Gaming Ltd., puede ajustar fácilmente los pronósticos y observar los efectos en tiempo real.
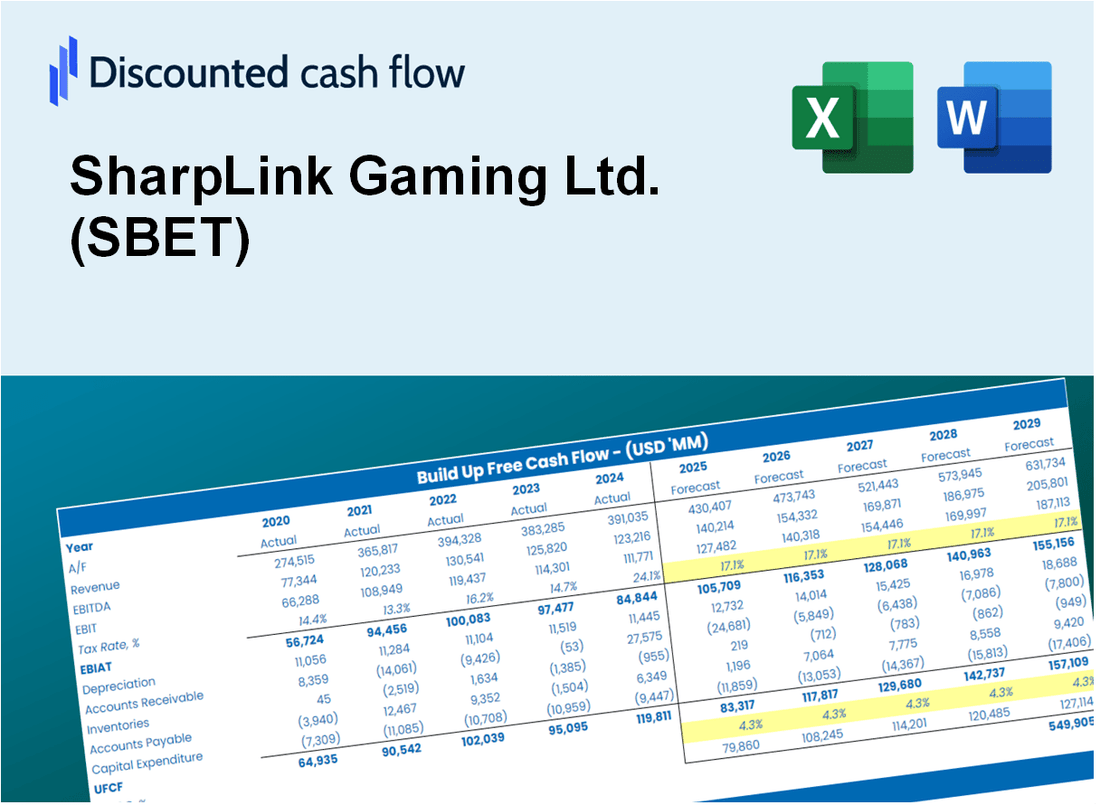
Discounted Cash Flow (DCF) - (USD MM)
| Year | AY1 2020 |
AY2 2021 |
AY3 2022 |
AY4 2023 |
AY5 2024 |
FY1 2025 |
FY2 2026 |
FY3 2027 |
FY4 2028 |
FY5 2029 |
|---|---|---|---|---|---|---|---|---|---|---|
| Revenue | 2.3 | 2.6 | 3.5 | 5.0 | 3.7 | 4.2 | 4.9 | 5.7 | 6.6 | 7.7 |
| Revenue Growth, % | 0 | 15.66 | 32.41 | 41.91 | -26.05 | 15.98 | 15.98 | 15.98 | 15.98 | 15.98 |
| EBITDA | -1.0 | -33.3 | -13.1 | -6.2 | -4.8 | -3.8 | -4.4 | -5.1 | -5.9 | -6.8 |
| EBITDA, % | -44.04 | -1261.85 | -375 | -125.02 | -129.72 | -88.81 | -88.81 | -88.81 | -88.81 | -88.81 |
| Depreciation | .1 | .2 | .9 | .2 | .0 | .4 | .4 | .5 | .6 | .7 |
| Depreciation, % | 5.84 | 7.82 | 26.14 | 4.77 | 0.33044 | 8.98 | 8.98 | 8.98 | 8.98 | 8.98 |
| EBIT | -1.1 | -33.5 | -14.0 | -6.4 | -4.8 | -3.8 | -4.4 | -5.1 | -6.0 | -6.9 |
| EBIT, % | -49.88 | -1269.68 | -401.14 | -129.8 | -130.05 | -89.98 | -89.98 | -89.98 | -89.98 | -89.98 |
| Total Cash | 2.6 | 6.1 | 1.4 | 2.5 | 1.4 | 2.8 | 3.2 | 3.8 | 4.4 | 5.1 |
| Total Cash, percent | .0 | .0 | .0 | .0 | .0 | .0 | .0 | .0 | .0 | .0 |
| Account Receivables | .6 | 1.1 | .5 | .4 | .3 | .8 | 1.0 | 1.1 | 1.3 | 1.5 |
| Account Receivables, % | 27.7 | 41.9 | 12.98 | 8.62 | 7.23 | 19.69 | 19.69 | 19.69 | 19.69 | 19.69 |
| Inventories | .0 | .0 | .0 | .0 | .0 | .0 | .0 | .0 | .0 | .0 |
| Inventories, % | -2.84E-14 | 0 | 0 | 0 | 0 | 0 | 0 | 0 | 0 | 0 |
| Accounts Payable | .0 | .8 | .7 | .8 | .3 | .6 | .7 | .9 | 1.0 | 1.2 |
| Accounts Payable, % | 0 | 30.87 | 19.75 | 16.84 | 7.68 | 15.03 | 15.03 | 15.03 | 15.03 | 15.03 |
| Capital Expenditure | -.3 | -.3 | -.2 | -.3 | .0 | -.3 | -.3 | -.4 | -.4 | -.5 |
| Capital Expenditure, % | -13.09 | -9.87 | -4.68 | -5.78 | -0.04693709 | -6.69 | -6.69 | -6.69 | -6.69 | -6.69 |
| Tax Rate, % | 325.75 | 325.75 | 325.75 | 325.75 | 325.75 | 325.75 | 325.75 | 325.75 | 325.75 | 325.75 |
| EBITAT | -1.1 | -55.6 | -15.1 | -8.2 | 10.8 | -3.1 | -3.5 | -4.1 | -4.8 | -5.5 |
| Depreciation | ||||||||||
| Changes in Account Receivables | ||||||||||
| Changes in Inventories | ||||||||||
| Changes in Accounts Payable | ||||||||||
| Capital Expenditure | ||||||||||
| UFCF | -1.9 | -55.4 | -13.8 | -8.0 | 10.4 | -3.2 | -3.5 | -4.0 | -4.7 | -5.4 |
| WACC, % | 50.92 | 50.92 | 50.92 | 50.92 | 50.92 | 50.92 | 50.92 | 50.92 | 50.92 | 50.92 |
| PV UFCF | ||||||||||
| SUM PV UFCF | -6.4 | |||||||||
| Long Term Growth Rate, % | 2.00 | |||||||||
| Free cash flow (T + 1) | -6 | |||||||||
| Terminal Value | -11 | |||||||||
| Present Terminal Value | -1 | |||||||||
| Enterprise Value | -8 | |||||||||
| Net Debt | -1 | |||||||||
| Equity Value | -6 | |||||||||
| Diluted Shares Outstanding, MM | 0 | |||||||||
| Equity Value Per Share | -22.26 |
What You Will Receive
- Customizable Excel Template: A fully editable Excel-based DCF Calculator featuring pre-filled financials for SharpLink Gaming Ltd. (SBET).
- Actual Market Data: Access to historical figures and forward-looking projections (highlighted in the designated cells).
- Adjustable Forecasts: Modify key assumptions such as revenue growth, EBITDA %, and WACC as per your analysis.
- Instant Calculations: Quickly observe how your inputs affect the valuation of SharpLink Gaming Ltd. (SBET).
- Professional Resource: Designed for investors, CFOs, consultants, and financial analysts in mind.
- Intuitive Layout: Organized for easy understanding and navigation, complete with step-by-step guidance.
Key Features
- Current SBET Data: Pre-loaded with SharpLink Gaming’s historical performance metrics and future projections.
- Fully Customizable Inputs: Modify parameters such as revenue growth, profit margins, WACC, tax rates, and capital expenditures.
- Dynamic Valuation Model: Instant updates to Net Present Value (NPV) and intrinsic value based on your adjustments.
- Scenario Analysis: Develop various forecasting scenarios to explore different valuation results.
- User-Friendly Interface: Intuitive design tailored for both industry professionals and newcomers.
How It Works
- Step 1: Download the Excel file for SharpLink Gaming Ltd. (SBET).
- Step 2: Review SharpLink's pre-filled financial data and projections.
- Step 3: Adjust key inputs such as user growth, operating margins, and market assumptions (highlighted cells).
- Step 4: Observe the DCF model refresh in real-time as you modify your inputs.
- Step 5: Evaluate the outputs and leverage the findings for your investment strategies.
Why Choose This Calculator for SharpLink Gaming Ltd. (SBET)?
- Designed for Industry Experts: A sophisticated tool tailored for gaming analysts, financial officers, and consultants.
- Comprehensive Data: SharpLink's historical and projected financials are preloaded to ensure precision.
- Flexible Scenario Analysis: Effortlessly simulate various forecasts and assumptions.
- Insightful Outputs: Instantly computes intrinsic value, NPV, and essential performance metrics.
- User-Friendly Interface: Detailed step-by-step guidance helps you navigate the process seamlessly.
Who Should Use SharpLink Gaming Ltd. (SBET)?
- Gamblers: Enhance your betting strategies with advanced analytics and insights.
- Sports Analysts: Streamline your analysis with a comprehensive platform designed for data-driven decisions.
- Affiliates: Easily customize tools for promoting gaming services to clients.
- Gaming Enthusiasts: Broaden your knowledge of gaming trends and market dynamics through real-time data.
- Educators and Students: Utilize the platform as a resource for learning about gaming and betting markets.
What the Template Contains
- Pre-Filled DCF Model: SharpLink Gaming Ltd.'s (SBET) financial data preloaded for immediate use.
- WACC Calculator: Detailed calculations for Weighted Average Cost of Capital specific to SharpLink Gaming Ltd. (SBET).
- Financial Ratios: Evaluate SharpLink Gaming Ltd.'s (SBET) profitability, leverage, and efficiency.
- Editable Inputs: Change assumptions such as growth, margins, and CAPEX to fit your scenarios for SharpLink Gaming Ltd. (SBET).
- Financial Statements: Annual and quarterly reports to support detailed analysis of SharpLink Gaming Ltd. (SBET).
- Interactive Dashboard: Easily visualize key valuation metrics and results for SharpLink Gaming Ltd. (SBET).
Disclaimer
All information, articles, and product details provided on this website are for general informational and educational purposes only. We do not claim any ownership over, nor do we intend to infringe upon, any trademarks, copyrights, logos, brand names, or other intellectual property mentioned or depicted on this site. Such intellectual property remains the property of its respective owners, and any references here are made solely for identification or informational purposes, without implying any affiliation, endorsement, or partnership.
We make no representations or warranties, express or implied, regarding the accuracy, completeness, or suitability of any content or products presented. Nothing on this website should be construed as legal, tax, investment, financial, medical, or other professional advice. In addition, no part of this site—including articles or product references—constitutes a solicitation, recommendation, endorsement, advertisement, or offer to buy or sell any securities, franchises, or other financial instruments, particularly in jurisdictions where such activity would be unlawful.
All content is of a general nature and may not address the specific circumstances of any individual or entity. It is not a substitute for professional advice or services. Any actions you take based on the information provided here are strictly at your own risk. You accept full responsibility for any decisions or outcomes arising from your use of this website and agree to release us from any liability in connection with your use of, or reliance upon, the content or products found herein.