
|
La valoración DCF de The Charles Schwab Corporation (SCHW) |
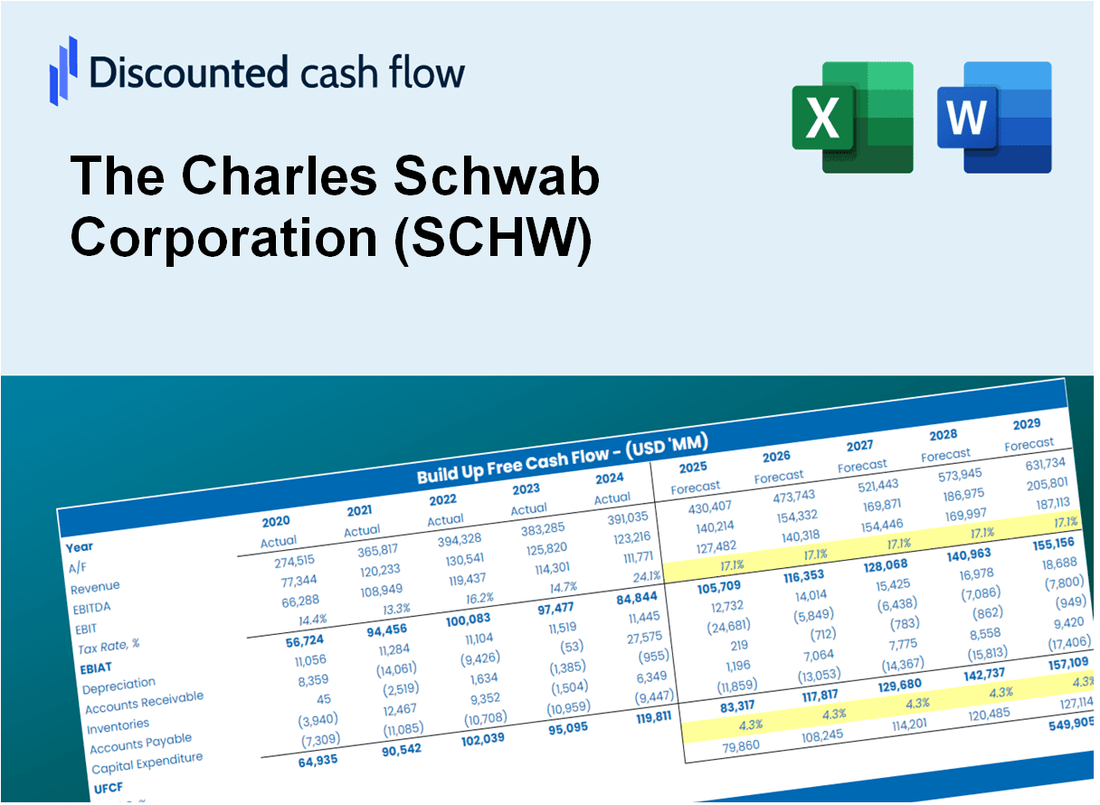
Completamente Editable: Adáptelo A Sus Necesidades En Excel O Sheets
Diseño Profesional: Plantillas Confiables Y Estándares De La Industria
Predeterminadas Para Un Uso Rápido Y Eficiente
Compatible con MAC / PC, completamente desbloqueado
No Se Necesita Experiencia; Fáciles De Seguir
The Charles Schwab Corporation (SCHW) Bundle
Ya sea que sea un inversor o analista, esta calculadora DCF (SCHW) es su recurso de referencia para una valoración precisa. Cargados con datos reales de la Corporación Charles Schwab, puede ajustar los pronósticos y observar instantáneamente los efectos.
What You Will Receive
- Comprehensive Financial Model: Leverage Charles Schwab’s actual data for accurate DCF valuation.
- Complete Forecast Flexibility: Modify revenue growth, profit margins, WACC, and other essential factors.
- Real-Time Calculations: Automatic updates provide immediate insights as adjustments are made.
- Professional-Grade Template: A polished Excel file crafted for high-quality valuation presentations.
- Adaptable and Reusable: Designed for versatility, enabling repeated application for in-depth forecasting.
Key Features
- Comprehensive Investment Tools: Offers a range of tools for stock analysis and portfolio management.
- Real-Time Market Data: Access to live quotes and market trends to make informed decisions.
- Customizable Research Reports: Tailor reports based on individual investment preferences and strategies.
- Integrated Trading Platform: Seamless execution of trades with user-friendly interface for (SCHW).
- Educational Resources: Extensive library of articles and tutorials to enhance investment knowledge.
How It Works
- 1. Access the Template: Download and open the Excel file containing The Charles Schwab Corporation’s (SCHW) preloaded data.
- 2. Modify Assumptions: Adjust key inputs such as growth rates, WACC, and capital expenditures.
- 3. Analyze Results Immediately: The DCF model automatically calculates intrinsic value and NPV in real-time.
- 4. Explore Scenarios: Evaluate various forecasts to assess different valuation results.
- 5. Present with Assurance: Share professional valuation insights to back your decisions.
Why Choose This Calculator?
- Accurate Data: Real Charles Schwab financials ensure reliable valuation results.
- Customizable: Adjust key parameters like growth rates, WACC, and tax rates to align with your projections.
- Time-Saving: Pre-built calculations save you from starting from scratch.
- Professional-Grade Tool: Tailored for investors, analysts, and consultants.
- User-Friendly: Intuitive design and step-by-step guidance make it accessible for all users.
Who Should Use This Product?
- Investors: Evaluate The Charles Schwab Corporation’s (SCHW) market performance before making investment decisions.
- CFOs and Financial Analysts: Optimize valuation methodologies and validate financial forecasts.
- Startup Founders: Understand how established financial institutions like The Charles Schwab Corporation are appraised.
- Consultants: Provide clients with comprehensive valuation analyses for informed decision-making.
- Students and Educators: Utilize current market data to enhance learning and application of valuation strategies.
What the Template Contains
- Historical Data: Includes The Charles Schwab Corporation’s (SCHW) past financials and baseline forecasts.
- DCF and Levered DCF Models: Detailed templates to calculate The Charles Schwab Corporation’s (SCHW) intrinsic value.
- WACC Sheet: Pre-built calculations for Weighted Average Cost of Capital.
- Editable Inputs: Modify key drivers like growth rates, EBITDA %, and CAPEX assumptions.
- Quarterly and Annual Statements: A complete breakdown of The Charles Schwab Corporation’s (SCHW) financials.
- Interactive Dashboard: Visualize valuation results and projections dynamically.
Disclaimer
All information, articles, and product details provided on this website are for general informational and educational purposes only. We do not claim any ownership over, nor do we intend to infringe upon, any trademarks, copyrights, logos, brand names, or other intellectual property mentioned or depicted on this site. Such intellectual property remains the property of its respective owners, and any references here are made solely for identification or informational purposes, without implying any affiliation, endorsement, or partnership.
We make no representations or warranties, express or implied, regarding the accuracy, completeness, or suitability of any content or products presented. Nothing on this website should be construed as legal, tax, investment, financial, medical, or other professional advice. In addition, no part of this site—including articles or product references—constitutes a solicitation, recommendation, endorsement, advertisement, or offer to buy or sell any securities, franchises, or other financial instruments, particularly in jurisdictions where such activity would be unlawful.
All content is of a general nature and may not address the specific circumstances of any individual or entity. It is not a substitute for professional advice or services. Any actions you take based on the information provided here are strictly at your own risk. You accept full responsibility for any decisions or outcomes arising from your use of this website and agree to release us from any liability in connection with your use of, or reliance upon, the content or products found herein.