
|
Valoración de DCF Corporation of India Limited (Sci.NS) |
Completamente Editable: Adáptelo A Sus Necesidades En Excel O Sheets
Diseño Profesional: Plantillas Confiables Y Estándares De La Industria
Predeterminadas Para Un Uso Rápido Y Eficiente
Compatible con MAC / PC, completamente desbloqueado
No Se Necesita Experiencia; Fáciles De Seguir
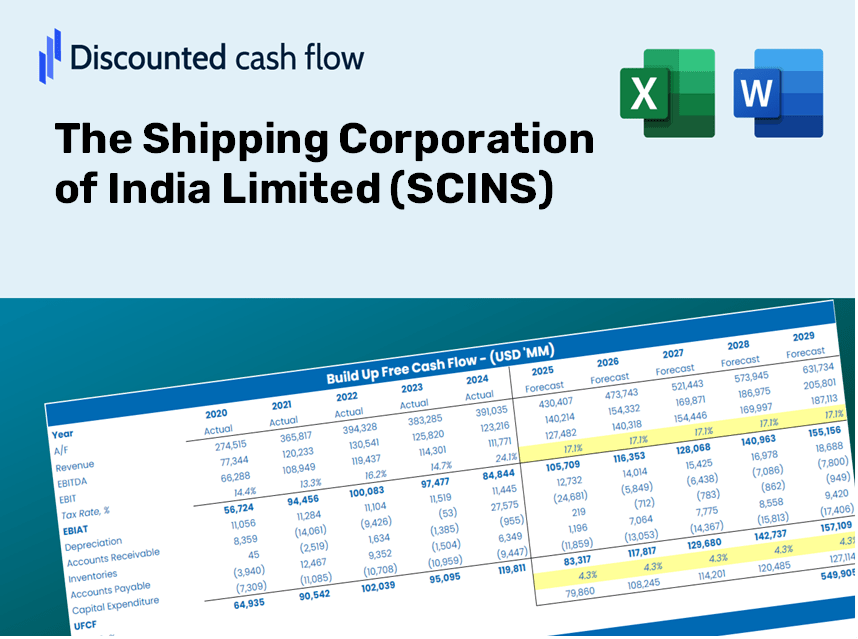
The Shipping Corporation of India Limited (SCI.NS) Bundle
¡Explore el futuro financiero de la corporación de envío de India Limited (Scins) con nuestra calculadora DCF fácil de usar! Ingrese sus suposiciones para el crecimiento, los márgenes y los costos para calcular el valor intrínseco de las Scins y refinar su estrategia de inversión.
Discounted Cash Flow (DCF) - (USD MM)
| Year | AY1 2021 |
AY2 2022 |
AY3 2023 |
AY4 2024 |
AY5 2025 |
FY1 2026 |
FY2 2027 |
FY3 2028 |
FY4 2029 |
FY5 2030 |
|---|---|---|---|---|---|---|---|---|---|---|
| Revenue | 36,907.2 | 49,313.5 | 57,939.5 | 50,320.2 | 56,058.3 | 54,755.3 | 53,482.5 | 52,239.3 | 51,025.1 | 49,839.0 |
| Revenue Growth, % | 0 | 33.61 | 17.49 | -13.15 | 11.4 | -2.32 | -2.32 | -2.32 | -2.32 | -2.32 |
| EBITDA | 13,698.7 | 16,052.5 | 16,756.0 | 16,225.3 | 17,642.8 | 17,774.1 | 17,360.9 | 16,957.4 | 16,563.2 | 16,178.2 |
| EBITDA, % | 37.12 | 32.55 | 28.92 | 32.24 | 31.47 | 32.46 | 32.46 | 32.46 | 32.46 | 32.46 |
| Depreciation | 6,279.4 | 6,352.5 | 7,531.6 | 8,893.8 | 9,513.2 | 8,491.4 | 8,294.0 | 8,101.2 | 7,912.9 | 7,729.0 |
| Depreciation, % | 17.01 | 12.88 | 13 | 17.67 | 16.97 | 15.51 | 15.51 | 15.51 | 15.51 | 15.51 |
| EBIT | 7,419.3 | 9,700.0 | 9,224.4 | 7,331.5 | 8,129.6 | 9,282.7 | 9,066.9 | 8,856.2 | 8,650.3 | 8,449.2 |
| EBIT, % | 20.1 | 19.67 | 15.92 | 14.57 | 14.5 | 16.95 | 16.95 | 16.95 | 16.95 | 16.95 |
| Total Cash | 2,247.8 | 5,944.0 | 7,053.9 | 11,886.0 | 7,573.8 | 7,386.5 | 7,214.8 | 7,047.1 | 6,883.3 | 6,723.3 |
| Total Cash, percent | .0 | .0 | .0 | .0 | .0 | .0 | .0 | .0 | .0 | .0 |
| Account Receivables | 9,286.0 | 11,799.8 | 16,940.6 | 18,078.2 | 11,945.2 | 14,845.4 | 14,500.4 | 14,163.3 | 13,834.1 | 13,512.5 |
| Account Receivables, % | 25.16 | 23.93 | 29.24 | 35.93 | 21.31 | 27.11 | 27.11 | 27.11 | 27.11 | 27.11 |
| Inventories | 876.9 | 1,748.2 | 1,500.1 | 1,741.2 | 1,927.6 | 1,687.4 | 1,648.2 | 1,609.9 | 1,572.5 | 1,535.9 |
| Inventories, % | 2.38 | 3.55 | 2.59 | 3.46 | 3.44 | 3.08 | 3.08 | 3.08 | 3.08 | 3.08 |
| Accounts Payable | 8,326.5 | 12,361.9 | 13,930.2 | 13,354.6 | 8,077.4 | 12,333.0 | 12,046.3 | 11,766.3 | 11,492.8 | 11,225.7 |
| Accounts Payable, % | 22.56 | 25.07 | 24.04 | 26.54 | 14.41 | 22.52 | 22.52 | 22.52 | 22.52 | 22.52 |
| Capital Expenditure | -1,967.3 | -4,917.9 | -4,758.1 | -5,117.7 | -2,919.2 | -4,259.2 | -4,160.2 | -4,063.5 | -3,969.0 | -3,876.8 |
| Capital Expenditure, % | -5.33 | -9.97 | -8.21 | -10.17 | -5.21 | -7.78 | -7.78 | -7.78 | -7.78 | -7.78 |
| Tax Rate, % | 0.96385 | 0.96385 | 0.96385 | 0.96385 | 0.96385 | 0.96385 | 0.96385 | 0.96385 | 0.96385 | 0.96385 |
| EBITAT | 7,245.8 | 9,229.1 | 9,995.6 | 7,714.0 | 8,051.2 | 9,131.2 | 8,919.0 | 8,711.7 | 8,509.2 | 8,311.4 |
| Depreciation | ||||||||||
| Changes in Account Receivables | ||||||||||
| Changes in Inventories | ||||||||||
| Changes in Accounts Payable | ||||||||||
| Capital Expenditure | ||||||||||
| UFCF | 9,721.5 | 11,314.0 | 9,444.7 | 9,535.8 | 15,314.6 | 14,959.0 | 13,150.4 | 12,844.8 | 12,546.2 | 12,254.6 |
| WACC, % | 5.46 | 5.43 | 5.5 | 5.5 | 5.48 | 5.47 | 5.47 | 5.47 | 5.47 | 5.47 |
| PV UFCF | ||||||||||
| SUM PV UFCF | 56,477.8 | |||||||||
| Long Term Growth Rate, % | 3.50 | |||||||||
| Free cash flow (T + 1) | 12,683 | |||||||||
| Terminal Value | 642,966 | |||||||||
| Present Terminal Value | 492,594 | |||||||||
| Enterprise Value | 549,072 | |||||||||
| Net Debt | 16,472 | |||||||||
| Equity Value | 532,599 | |||||||||
| Diluted Shares Outstanding, MM | 466 | |||||||||
| Equity Value Per Share | 1,143.39 |
Benefits You Will Receive
- Pre-Populated Financial Model: SCINS's actual data allows for accurate DCF valuation.
- Comprehensive Forecast Control: Modify revenue growth, profit margins, WACC, and other essential factors.
- Real-Time Calculations: Automatic updates provide immediate results as you adjust inputs.
- Professional-Grade Template: A polished Excel file created for high-quality valuation.
- Flexible and Reusable: Designed for adaptability, perfect for repeated detailed forecasts.
Key Features
- Pre-Loaded Data: Historical financial statements and forecasts for The Shipping Corporation of India Limited (SCINS).
- Fully Adjustable Inputs: Customize WACC, tax rates, revenue growth, and EBITDA margins as needed.
- Instant Results: View the intrinsic value of The Shipping Corporation of India Limited (SCINS) refresh in real time.
- Clear Visual Outputs: Dashboard charts illustrate valuation results and essential metrics.
- Built for Accuracy: A professional-grade tool tailored for analysts, investors, and finance professionals.
How It Functions
- Download the Template: Gain immediate access to the Excel-based SCINS DCF Calculator.
- Enter Your Assumptions: Modify the yellow-highlighted cells to reflect growth rates, WACC, margins, and other variables.
- Instant Calculations: The model will automatically calculate the intrinsic value of The Shipping Corporation of India Limited (SCINS).
- Test Scenarios: Experiment with various assumptions to assess potential changes in valuation.
- Analyze and Decide: Utilize the insights gained to inform your investment or financial analysis.
Why Choose This Calculator for The Shipping Corporation of India Limited (SCINS)?
- Accuracy: Based on reliable SCINS financial data to ensure precise calculations.
- Flexibility: Allows users to easily test and adjust inputs as needed.
- Time-Saving: Eliminate the complexities of creating a DCF model from the ground up.
- Professional-Grade: Crafted with the expertise and precision expected by senior financial executives.
- User-Friendly: Intuitive design makes it accessible, even for those new to financial modeling.
Who Can Benefit from This Product?
- Marine Industry Investors: Develop comprehensive and accurate valuation models for portfolio evaluations related to shipping and logistics.
- Corporate Finance Departments: Assess valuation scenarios to inform strategic decisions within the maritime sector.
- Consultants and Advisors: Equip clients with precise valuation insights specifically for The Shipping Corporation of India Limited (SCINS).
- Students and Educators: Utilize real-life data to enhance practical learning and teaching in financial modeling.
- Logistics Enthusiasts: Gain insights into how shipping companies like The Shipping Corporation of India Limited (SCINS) are valued within the market.
Contents of the Template
- Operating and Balance Sheet Data: Pre-filled historical data and forecasts for The Shipping Corporation of India Limited (SCINS), including revenue, EBITDA, EBIT, and capital expenditures.
- WACC Calculation: A dedicated sheet for Weighted Average Cost of Capital (WACC), featuring parameters such as Beta, risk-free rate, and share price.
- DCF Valuation (Unlevered and Levered): Customizable Discounted Cash Flow models that present intrinsic value along with comprehensive calculations.
- Financial Statements: Pre-loaded financial statements (annual and quarterly) to facilitate thorough analysis.
- Key Ratios: Includes profitability, leverage, and efficiency ratios relevant to The Shipping Corporation of India Limited (SCINS).
- Dashboard and Charts: Visual representations of valuation outputs and underlying assumptions for easy result analysis.
Disclaimer
All information, articles, and product details provided on this website are for general informational and educational purposes only. We do not claim any ownership over, nor do we intend to infringe upon, any trademarks, copyrights, logos, brand names, or other intellectual property mentioned or depicted on this site. Such intellectual property remains the property of its respective owners, and any references here are made solely for identification or informational purposes, without implying any affiliation, endorsement, or partnership.
We make no representations or warranties, express or implied, regarding the accuracy, completeness, or suitability of any content or products presented. Nothing on this website should be construed as legal, tax, investment, financial, medical, or other professional advice. In addition, no part of this site—including articles or product references—constitutes a solicitation, recommendation, endorsement, advertisement, or offer to buy or sell any securities, franchises, or other financial instruments, particularly in jurisdictions where such activity would be unlawful.
All content is of a general nature and may not address the specific circumstances of any individual or entity. It is not a substitute for professional advice or services. Any actions you take based on the information provided here are strictly at your own risk. You accept full responsibility for any decisions or outcomes arising from your use of this website and agree to release us from any liability in connection with your use of, or reliance upon, the content or products found herein.