
|
Valoración DCF de scPharmaceuticals Inc. (SCPH) |
Completamente Editable: Adáptelo A Sus Necesidades En Excel O Sheets
Diseño Profesional: Plantillas Confiables Y Estándares De La Industria
Predeterminadas Para Un Uso Rápido Y Eficiente
Compatible con MAC / PC, completamente desbloqueado
No Se Necesita Experiencia; Fáciles De Seguir
scPharmaceuticals Inc. (SCPH) Bundle
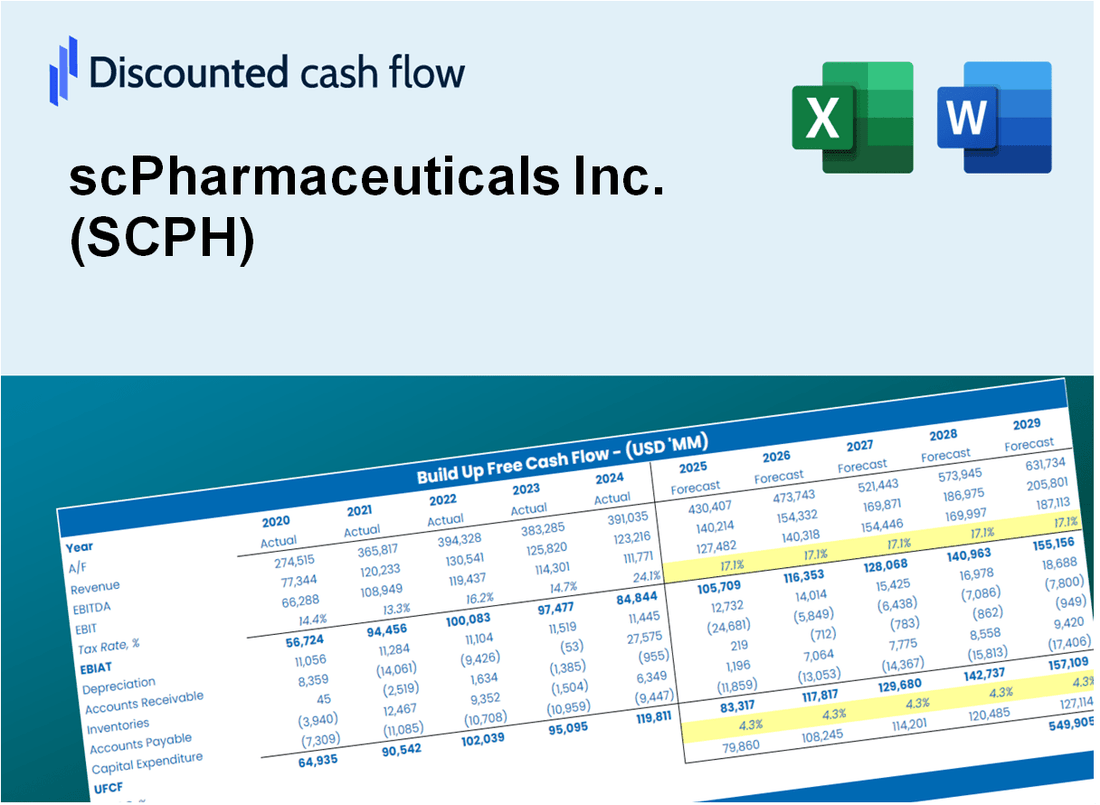
Diseñada para la precisión, nuestra calculadora DCF SCPHarmaceuticals Inc. (SCPH) le permite evaluar la valoración de SCPHarmaceuticals utilizando datos financieros del mundo real y proporciona flexibilidad completa para modificar todos los parámetros esenciales para proyecciones más precisas.
What You Will Get
- Editable Excel Template: A fully customizable Excel-based DCF Calculator featuring pre-filled real SCPH financials.
- Real-World Data: Historical data and forward-looking estimates (as indicated in the yellow cells).
- Forecast Flexibility: Modify forecast assumptions such as revenue growth, EBITDA %, and WACC.
- Automatic Calculations: Instantly observe the effects of your inputs on scPharmaceuticals' valuation.
- Professional Tool: Designed for investors, CFOs, consultants, and financial analysts.
- User-Friendly Design: Organized for clarity and ease of use, complete with step-by-step instructions.
Key Features
- 🔍 Real-Life SCPH Financials: Pre-filled historical and projected data for scPharmaceuticals Inc.
- ✏️ Fully Customizable Inputs: Adjust all critical parameters (yellow cells) like WACC, growth %, and tax rates.
- 📊 Professional DCF Valuation: Built-in formulas calculate scPharmaceuticals’ intrinsic value using the Discounted Cash Flow method.
- ⚡ Instant Results: Visualize scPharmaceuticals’ valuation instantly after making changes.
- Scenario Analysis: Test and compare outcomes for various financial assumptions side-by-side.
How It Works
- Step 1: Download the Excel file.
- Step 2: Review pre-entered scPharmaceuticals Inc. (SCPH) data (historical and projected).
- Step 3: Adjust key assumptions (yellow cells) based on your analysis.
- Step 4: View automatic recalculations for scPharmaceuticals Inc. (SCPH)'s intrinsic value.
- Step 5: Use the outputs for investment decisions or reporting.
Why Choose This Calculator for scPharmaceuticals Inc. (SCPH)?
- All-in-One Solution: Features DCF, WACC, and financial ratio analyses tailored for scPharmaceuticals Inc. (SCPH).
- Flexible Variables: Modify the yellow-highlighted cells to explore different financial scenarios.
- In-Depth Analysis: Automatically determines scPharmaceuticals Inc. (SCPH)'s intrinsic value and Net Present Value.
- Ready-to-Use Data: Comes with historical and projected data for reliable analysis.
- High-Quality Standards: Perfect for financial analysts, investors, and business advisors focused on scPharmaceuticals Inc. (SCPH).
Who Should Use This Product?
- Investors: Accurately estimate scPharmaceuticals Inc.'s (SCPH) fair value before making investment decisions.
- CFOs: Utilize a professional-grade DCF model for financial reporting and analysis related to scPharmaceuticals Inc. (SCPH).
- Consultants: Quickly customize the template for valuation reports tailored to scPharmaceuticals Inc. (SCPH) clients.
- Entrepreneurs: Gain insights into financial modeling practices employed by leading pharmaceutical companies.
- Educators: Use it as a teaching resource to illustrate valuation methodologies relevant to scPharmaceuticals Inc. (SCPH).
What the Template Contains
- Preloaded SCPH Data: Historical and projected financial data, including revenue, EBIT, and capital expenditures.
- DCF and WACC Models: Professional-grade sheets for calculating intrinsic value and Weighted Average Cost of Capital.
- Editable Inputs: Yellow-highlighted cells for adjusting revenue growth, tax rates, and discount rates.
- Financial Statements: Comprehensive annual and quarterly financials for deeper analysis.
- Key Ratios: Profitability, leverage, and efficiency ratios to evaluate performance.
- Dashboard and Charts: Visual summaries of valuation outcomes and assumptions.
Disclaimer
All information, articles, and product details provided on this website are for general informational and educational purposes only. We do not claim any ownership over, nor do we intend to infringe upon, any trademarks, copyrights, logos, brand names, or other intellectual property mentioned or depicted on this site. Such intellectual property remains the property of its respective owners, and any references here are made solely for identification or informational purposes, without implying any affiliation, endorsement, or partnership.
We make no representations or warranties, express or implied, regarding the accuracy, completeness, or suitability of any content or products presented. Nothing on this website should be construed as legal, tax, investment, financial, medical, or other professional advice. In addition, no part of this site—including articles or product references—constitutes a solicitation, recommendation, endorsement, advertisement, or offer to buy or sell any securities, franchises, or other financial instruments, particularly in jurisdictions where such activity would be unlawful.
All content is of a general nature and may not address the specific circumstances of any individual or entity. It is not a substitute for professional advice or services. Any actions you take based on the information provided here are strictly at your own risk. You accept full responsibility for any decisions or outcomes arising from your use of this website and agree to release us from any liability in connection with your use of, or reliance upon, the content or products found herein.