
|
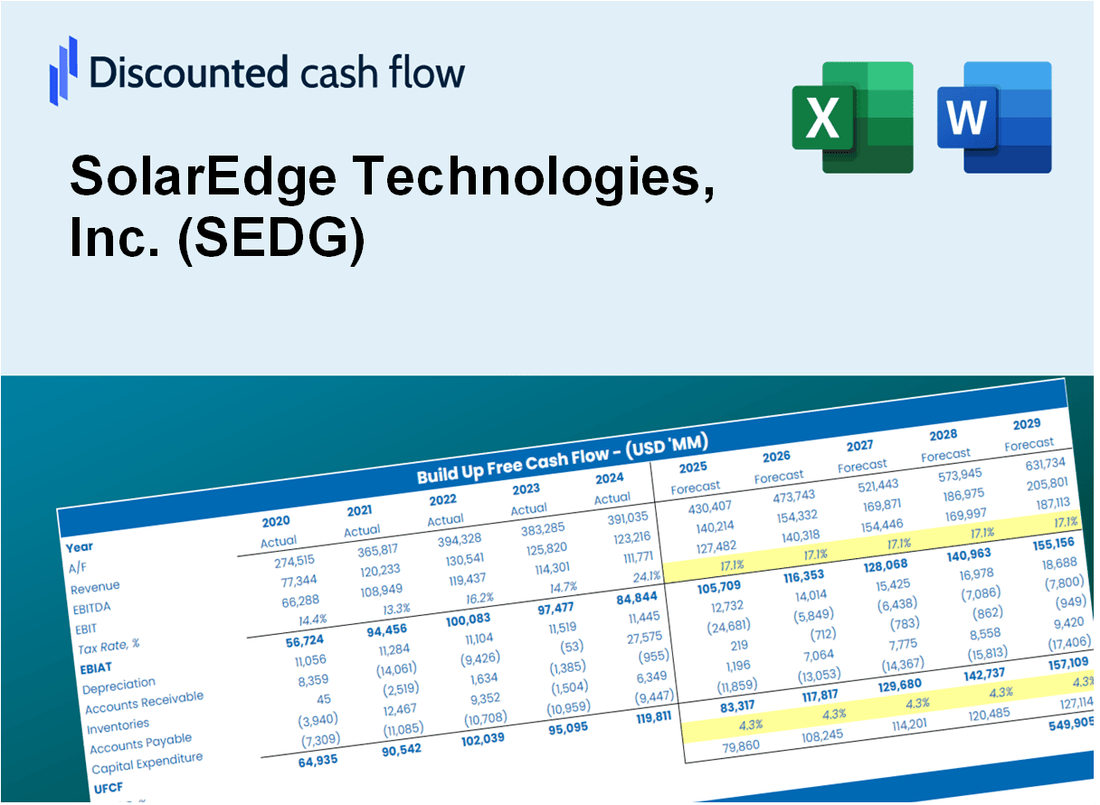
Valoración DCF de SolarEdge Technologies, Inc. (SEDG) |
Completamente Editable: Adáptelo A Sus Necesidades En Excel O Sheets
Diseño Profesional: Plantillas Confiables Y Estándares De La Industria
Predeterminadas Para Un Uso Rápido Y Eficiente
Compatible con MAC / PC, completamente desbloqueado
No Se Necesita Experiencia; Fáciles De Seguir
SolarEdge Technologies, Inc. (SEDG) Bundle
¡Descubra el verdadero valor de Solaredge Technologies, Inc. (SEDG) con nuestra calculadora DCF avanzada! Ajuste los supuestos esenciales, explore varios escenarios y evalúe los efectos de los cambios en la valoración de Solaredge, todo dentro de una sola plantilla de Excel.
Discounted Cash Flow (DCF) - (USD MM)
| Year | AY1 2020 |
AY2 2021 |
AY3 2022 |
AY4 2023 |
AY5 2024 |
FY1 2025 |
FY2 2026 |
FY3 2027 |
FY4 2028 |
FY5 2029 |
|---|---|---|---|---|---|---|---|---|---|---|
| Revenue | 1,459.3 | 1,963.9 | 3,110.3 | 2,976.5 | 901.5 | 944.1 | 988.8 | 1,035.7 | 1,084.7 | 1,136.1 |
| Revenue Growth, % | 0 | 34.58 | 58.38 | -4.3 | -69.71 | 4.73 | 4.73 | 4.73 | 4.73 | 4.73 |
| EBITDA | 198.7 | 230.3 | 231.3 | 142.5 | -1,640.4 | -117.9 | -123.5 | -129.3 | -135.4 | -141.9 |
| EBITDA, % | 13.62 | 11.73 | 7.44 | 4.79 | -181.97 | -12.49 | -12.49 | -12.49 | -12.49 | -12.49 |
| Depreciation | 31.8 | 39.5 | 49.7 | 57.2 | 59.9 | 27.1 | 28.4 | 29.7 | 31.1 | 32.6 |
| Depreciation, % | 2.18 | 2.01 | 1.6 | 1.92 | 6.64 | 2.87 | 2.87 | 2.87 | 2.87 | 2.87 |
| EBIT | 166.9 | 190.7 | 181.6 | 85.3 | -1,700.2 | -132.5 | -138.7 | -145.3 | -152.2 | -159.4 |
| EBIT, % | 11.43 | 9.71 | 5.84 | 2.87 | -188.61 | -14.03 | -14.03 | -14.03 | -14.03 | -14.03 |
| Total Cash | 1,030.9 | 697.8 | 1,024.2 | 860.0 | 585.9 | 440.0 | 460.8 | 482.6 | 505.5 | 529.4 |
| Total Cash, percent | .0 | .0 | .0 | .0 | .0 | .0 | .0 | .0 | .0 | .0 |
| Account Receivables | 325.4 | 527.4 | 1,059.0 | 780.8 | 342.4 | 278.4 | 291.5 | 305.3 | 319.8 | 334.9 |
| Account Receivables, % | 22.3 | 26.85 | 34.05 | 26.23 | 37.98 | 29.48 | 29.48 | 29.48 | 29.48 | 29.48 |
| Inventories | 331.7 | 380.1 | 729.2 | 1,443.4 | 645.9 | 350.6 | 367.2 | 384.6 | 402.8 | 421.9 |
| Inventories, % | 22.73 | 19.36 | 23.44 | 48.49 | 71.65 | 37.14 | 37.14 | 37.14 | 37.14 | 37.14 |
| Accounts Payable | 162.1 | 252.1 | 459.8 | 386.5 | 93.5 | 117.2 | 122.8 | 128.6 | 134.7 | 141.1 |
| Accounts Payable, % | 11.1 | 12.84 | 14.78 | 12.98 | 10.37 | 12.42 | 12.42 | 12.42 | 12.42 | 12.42 |
| Capital Expenditure | -126.8 | -149.3 | -169.3 | -170.5 | -108.2 | -74.5 | -78.0 | -81.7 | -85.6 | -89.7 |
| Capital Expenditure, % | -8.69 | -7.6 | -5.44 | -5.73 | -12 | -7.89 | -7.89 | -7.89 | -7.89 | -7.89 |
| Tax Rate, % | -5.74 | -5.74 | -5.74 | -5.74 | -5.74 | -5.74 | -5.74 | -5.74 | -5.74 | -5.74 |
| EBITAT | 143.1 | 172.3 | 96.1 | 36.3 | -1,797.8 | -98.4 | -103.1 | -108.0 | -113.1 | -118.4 |
| Depreciation | ||||||||||
| Changes in Account Receivables | ||||||||||
| Changes in Inventories | ||||||||||
| Changes in Accounts Payable | ||||||||||
| Capital Expenditure | ||||||||||
| UFCF | -446.9 | -97.8 | -696.4 | -586.5 | -903.1 | 237.2 | -177.0 | -185.4 | -194.1 | -203.3 |
| WACC, % | 9.41 | 9.45 | 9.08 | 8.97 | 9.55 | 9.29 | 9.29 | 9.29 | 9.29 | 9.29 |
| PV UFCF | ||||||||||
| SUM PV UFCF | -339.6 | |||||||||
| Long Term Growth Rate, % | 4.00 | |||||||||
| Free cash flow (T + 1) | -211 | |||||||||
| Terminal Value | -3,996 | |||||||||
| Present Terminal Value | -2,563 | |||||||||
| Enterprise Value | -2,903 | |||||||||
| Net Debt | 483 | |||||||||
| Equity Value | -3,385 | |||||||||
| Diluted Shares Outstanding, MM | 57 | |||||||||
| Equity Value Per Share | -59.31 |
What You Will Get
- Editable Forecast Inputs: Easily modify assumptions (growth %, margins, WACC) to explore various scenarios.
- Real-World Data: SolarEdge Technologies, Inc. (SEDG) financial data pre-loaded to kickstart your analysis.
- Automatic DCF Outputs: The template computes Net Present Value (NPV) and intrinsic value automatically.
- Customizable and Professional: A refined Excel model that adjusts to your valuation requirements.
- Built for Analysts and Investors: Perfect for evaluating projections, validating strategies, and enhancing efficiency.
Key Features
- Accurate Solar Market Data: Access reliable pre-loaded historical performance and future forecasts for SolarEdge Technologies, Inc. (SEDG).
- Adjustable Forecast Parameters: Modify highlighted fields such as WACC, growth rates, and profit margins to suit your analysis.
- Real-Time Calculations: Automatic updates for DCF, Net Present Value (NPV), and cash flow assessments.
- Interactive Dashboard: User-friendly charts and summaries to help visualize your valuation outcomes.
- Designed for All Users: A straightforward, intuitive layout tailored for investors, CFOs, and consultants alike.
How It Works
- Step 1: Download the prebuilt Excel template featuring SolarEdge Technologies, Inc. (SEDG) data.
- Step 2: Navigate through the pre-filled sheets to familiarize yourself with the essential metrics.
- Step 3: Modify forecasts and assumptions in the editable yellow cells (WACC, growth, margins).
- Step 4: Instantly see the updated results, including SolarEdge’s intrinsic value.
- Step 5: Utilize the outputs to make informed investment decisions or create detailed reports.
Why Choose This Calculator?
- Accuracy: Utilizes real SolarEdge financial data for precise calculations.
- Flexibility: Allows users to easily adjust and experiment with various inputs.
- Time-Saving: Eliminate the need to create a financial model from the ground up.
- Professional-Grade: Crafted with the expertise and standards expected by CFOs.
- User-Friendly: Intuitive interface suitable for users at all financial skill levels.
Who Should Use This Product?
- Individual Investors: Make informed decisions about buying or selling SolarEdge Technologies stock (SEDG).
- Financial Analysts: Streamline valuation processes with ready-to-use financial models for SolarEdge Technologies (SEDG).
- Consultants: Deliver professional valuation insights on SolarEdge Technologies (SEDG) to clients quickly and accurately.
- Business Owners: Understand how leading companies like SolarEdge Technologies (SEDG) are valued to guide your own strategy.
- Finance Students: Learn valuation techniques using real-world data and scenarios related to SolarEdge Technologies (SEDG).
What the Template Contains
- Historical Data: Includes SolarEdge Technologies, Inc.'s (SEDG) past financials and baseline forecasts.
- DCF and Levered DCF Models: Detailed templates to calculate SolarEdge’s intrinsic value.
- WACC Sheet: Pre-built calculations for Weighted Average Cost of Capital.
- Editable Inputs: Modify key drivers like growth rates, EBITDA %, and CAPEX assumptions.
- Quarterly and Annual Statements: A complete breakdown of SolarEdge’s financials.
- Interactive Dashboard: Visualize valuation results and projections dynamically.
Disclaimer
All information, articles, and product details provided on this website are for general informational and educational purposes only. We do not claim any ownership over, nor do we intend to infringe upon, any trademarks, copyrights, logos, brand names, or other intellectual property mentioned or depicted on this site. Such intellectual property remains the property of its respective owners, and any references here are made solely for identification or informational purposes, without implying any affiliation, endorsement, or partnership.
We make no representations or warranties, express or implied, regarding the accuracy, completeness, or suitability of any content or products presented. Nothing on this website should be construed as legal, tax, investment, financial, medical, or other professional advice. In addition, no part of this site—including articles or product references—constitutes a solicitation, recommendation, endorsement, advertisement, or offer to buy or sell any securities, franchises, or other financial instruments, particularly in jurisdictions where such activity would be unlawful.
All content is of a general nature and may not address the specific circumstances of any individual or entity. It is not a substitute for professional advice or services. Any actions you take based on the information provided here are strictly at your own risk. You accept full responsibility for any decisions or outcomes arising from your use of this website and agree to release us from any liability in connection with your use of, or reliance upon, the content or products found herein.