
|
Valoración DCF de Semrush Holdings, Inc. (SEMR) |
Completamente Editable: Adáptelo A Sus Necesidades En Excel O Sheets
Diseño Profesional: Plantillas Confiables Y Estándares De La Industria
Predeterminadas Para Un Uso Rápido Y Eficiente
Compatible con MAC / PC, completamente desbloqueado
No Se Necesita Experiencia; Fáciles De Seguir
Semrush Holdings, Inc. (SEMR) Bundle
¡Explore las perspectivas financieras de Semrush Holdings, Inc. (SEMR) con nuestra calculadora DCF fácil de usar! Ingrese sus pronósticos para el crecimiento, los márgenes y los gastos para calcular el valor intrínseco de SEMRUSH Holdings, Inc. (SEMR) y refinar su enfoque de inversión.
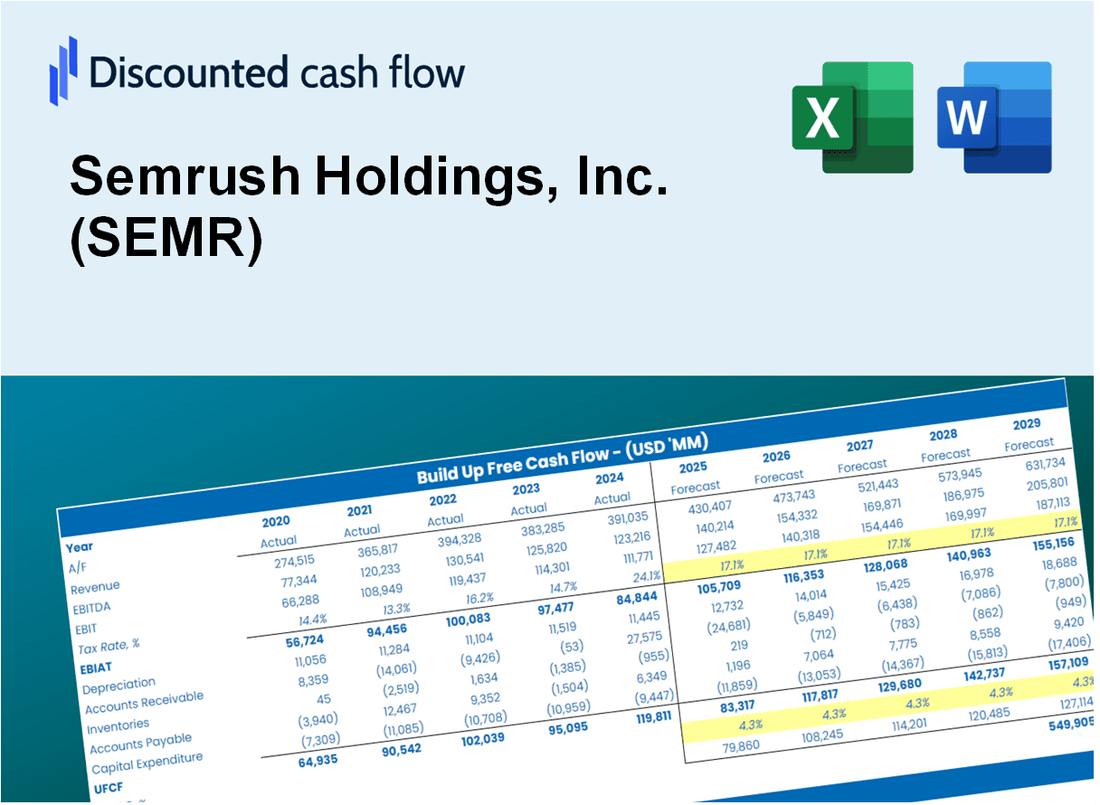
Discounted Cash Flow (DCF) - (USD MM)
| Year | AY1 2020 |
AY2 2021 |
AY3 2022 |
AY4 2023 |
AY5 2024 |
FY1 2025 |
FY2 2026 |
FY3 2027 |
FY4 2028 |
FY5 2029 |
|---|---|---|---|---|---|---|---|---|---|---|
| Revenue | 124.9 | 188.0 | 254.3 | 307.7 | 376.8 | 498.6 | 659.7 | 873.0 | 1,155.1 | 1,528.4 |
| Revenue Growth, % | 0 | 50.55 | 35.27 | 20.98 | 22.47 | 32.32 | 32.32 | 32.32 | 32.32 | 32.32 |
| EBITDA | -4.7 | 1.1 | -18.5 | .4 | 18.4 | -5.4 | -7.2 | -9.5 | -12.5 | -16.6 |
| EBITDA, % | -3.73 | 0.55957 | -7.26 | 0.13488 | 4.88 | -1.08 | -1.08 | -1.08 | -1.08 | -1.08 |
| Depreciation | 1.5 | 3.5 | 6.7 | 6.8 | 10.1 | 10.5 | 13.9 | 18.4 | 24.4 | 32.3 |
| Depreciation, % | 1.19 | 1.88 | 2.61 | 2.21 | 2.67 | 2.11 | 2.11 | 2.11 | 2.11 | 2.11 |
| EBIT | -6.1 | -2.5 | -25.1 | -6.4 | 8.3 | -15.9 | -21.1 | -27.9 | -36.9 | -48.9 |
| EBIT, % | -4.92 | -1.32 | -9.87 | -2.07 | 2.2 | -3.2 | -3.2 | -3.2 | -3.2 | -3.2 |
| Total Cash | 35.5 | 269.7 | 237.5 | 238.6 | 235.6 | 360.9 | 477.5 | 631.9 | 836.1 | 1,106.3 |
| Total Cash, percent | .0 | .0 | .0 | .0 | .0 | .0 | .0 | .0 | .0 | .0 |
| Account Receivables | 1.4 | 2.2 | 3.6 | 7.9 | 9.0 | 8.6 | 11.4 | 15.1 | 19.9 | 26.4 |
| Account Receivables, % | 1.12 | 1.16 | 1.4 | 2.57 | 2.38 | 1.73 | 1.73 | 1.73 | 1.73 | 1.73 |
| Inventories | .0 | .0 | .0 | .0 | .0 | .0 | .0 | .0 | .0 | .0 |
| Inventories, % | 0 | 0 | 0 | 0 | 0 | 0 | 0 | 0 | 0 | 0 |
| Accounts Payable | 8.7 | 9.9 | 15.5 | 9.2 | 10.5 | 24.0 | 31.8 | 42.0 | 55.6 | 73.6 |
| Accounts Payable, % | 6.93 | 5.29 | 6.09 | 2.99 | 2.78 | 4.81 | 4.81 | 4.81 | 4.81 | 4.81 |
| Capital Expenditure | -3.4 | -3.8 | -5.9 | -7.7 | -3.8 | -10.5 | -13.9 | -18.4 | -24.4 | -32.3 |
| Capital Expenditure, % | -2.72 | -2.01 | -2.34 | -2.49 | -1.01 | -2.11 | -2.11 | -2.11 | -2.11 | -2.11 |
| Tax Rate, % | 59.63 | 59.63 | 59.63 | 59.63 | 59.63 | 59.63 | 59.63 | 59.63 | 59.63 | 59.63 |
| EBITAT | -6.7 | -2.7 | -25.8 | -1.3 | 3.4 | -11.5 | -15.2 | -20.1 | -26.6 | -35.3 |
| Depreciation | ||||||||||
| Changes in Account Receivables | ||||||||||
| Changes in Inventories | ||||||||||
| Changes in Accounts Payable | ||||||||||
| Capital Expenditure | ||||||||||
| UFCF | -1.4 | -2.5 | -20.9 | -12.8 | 9.8 | 2.4 | -10.2 | -13.6 | -17.9 | -23.7 |
| WACC, % | 11.24 | 11.24 | 11.24 | 11.2 | 11.21 | 11.23 | 11.23 | 11.23 | 11.23 | 11.23 |
| PV UFCF | ||||||||||
| SUM PV UFCF | -41.6 | |||||||||
| Long Term Growth Rate, % | 2.00 | |||||||||
| Free cash flow (T + 1) | -24 | |||||||||
| Terminal Value | -262 | |||||||||
| Present Terminal Value | -154 | |||||||||
| Enterprise Value | -196 | |||||||||
| Net Debt | -37 | |||||||||
| Equity Value | -159 | |||||||||
| Diluted Shares Outstanding, MM | 149 | |||||||||
| Equity Value Per Share | -1.07 |
What You Will Get
- Editable Excel Template: A fully customizable Excel-based DCF Calculator featuring pre-filled real SEMR financials.
- Real-World Data: Historical data and forward-looking estimates (highlighted in the yellow cells).
- Forecast Flexibility: Adjust forecast assumptions such as revenue growth, EBITDA %, and WACC.
- Automatic Calculations: Instantly observe the impact of your inputs on Semrush's valuation.
- Professional Tool: Designed for investors, CFOs, consultants, and financial analysts.
- User-Friendly Design: Organized for clarity and ease of use, complete with step-by-step instructions.
Key Features
- Customizable SEO Metrics: Adjust essential inputs like keyword rankings, traffic estimates, and conversion rates.
- Instant Competitive Analysis: Provides real-time insights into competitors' strategies and performance.
- Data-Driven Accuracy: Utilizes Semrush’s extensive database for precise and actionable marketing insights.
- Effortless Reporting: Generate comprehensive reports to visualize performance and track progress effortlessly.
- Efficiency Booster: Streamline your digital marketing efforts without the hassle of manual data compilation.
How It Works
- Step 1: Download the Excel file.
- Step 2: Review Semrush's pre-filled financial data and forecasts.
- Step 3: Modify critical inputs like revenue growth, WACC, and tax rates (highlighted cells).
- Step 4: Watch the DCF model update instantly as you tweak assumptions.
- Step 5: Analyze the outputs and use the results for investment decisions.
Why Choose This Tool for Semrush Holdings, Inc. (SEMR)?
- Designed for Experts: A sophisticated resource utilized by marketers, analysts, and business strategists.
- Comprehensive Data: Access to Semrush's historical and projected performance metrics for precise analysis.
- Versatile Testing: Effortlessly explore various marketing scenarios and assumptions.
- Insightful Outputs: Automatically generates key performance indicators and analytics summaries.
- User-Friendly: Intuitive instructions lead you through every step of the process.
Who Should Use Semrush Holdings, Inc. (SEMR)?
- Digital Marketers: Enhance your strategies with advanced SEO and content marketing tools.
- Marketing Analysts: Streamline your workflow with comprehensive analytics and reporting features.
- Consultants: Easily tailor the platform for client projects and performance assessments.
- Business Owners: Gain insights into your online presence and improve your digital marketing efforts.
- Students and Educators: Utilize it as a hands-on resource for learning digital marketing principles.
What the Template Contains
- Pre-Filled Data: Includes Semrush Holdings, Inc.'s historical financials and forecasts.
- Discounted Cash Flow Model: Editable DCF valuation model with automatic calculations.
- Weighted Average Cost of Capital (WACC): A dedicated sheet for calculating WACC based on custom inputs.
- Key Financial Ratios: Analyze Semrush's profitability, efficiency, and leverage.
- Customizable Inputs: Edit revenue growth, margins, and tax rates with ease.
- Clear Dashboard: Charts and tables summarizing key valuation results.
Disclaimer
All information, articles, and product details provided on this website are for general informational and educational purposes only. We do not claim any ownership over, nor do we intend to infringe upon, any trademarks, copyrights, logos, brand names, or other intellectual property mentioned or depicted on this site. Such intellectual property remains the property of its respective owners, and any references here are made solely for identification or informational purposes, without implying any affiliation, endorsement, or partnership.
We make no representations or warranties, express or implied, regarding the accuracy, completeness, or suitability of any content or products presented. Nothing on this website should be construed as legal, tax, investment, financial, medical, or other professional advice. In addition, no part of this site—including articles or product references—constitutes a solicitation, recommendation, endorsement, advertisement, or offer to buy or sell any securities, franchises, or other financial instruments, particularly in jurisdictions where such activity would be unlawful.
All content is of a general nature and may not address the specific circumstances of any individual or entity. It is not a substitute for professional advice or services. Any actions you take based on the information provided here are strictly at your own risk. You accept full responsibility for any decisions or outcomes arising from your use of this website and agree to release us from any liability in connection with your use of, or reliance upon, the content or products found herein.