
|
Southern First Bancshares, Inc. (SFST): Análisis de 5 Fuerzas [Actualizado en Ene-2025] |
Completamente Editable: Adáptelo A Sus Necesidades En Excel O Sheets
Diseño Profesional: Plantillas Confiables Y Estándares De La Industria
Predeterminadas Para Un Uso Rápido Y Eficiente
Compatible con MAC / PC, completamente desbloqueado
No Se Necesita Experiencia; Fáciles De Seguir
Southern First Bancshares, Inc. (SFST) Bundle
En el panorama dinámico de la banca regional, Southern First Bancshares, Inc. (SFST) navega por un complejo ecosistema de fuerzas competitivas que dan forma a su posicionamiento estratégico. A medida que la tecnología financiera evoluciona y la dinámica del mercado cambia, la comprensión de la intrincada interacción de la energía de los proveedores, la dinámica del cliente, la rivalidad competitiva, los sustitutos potenciales y las barreras de entrada se vuelven cruciales para descifrar la ventaja competitiva del banco en el sureste de los Estados Unidos. Este análisis de las cinco fuerzas de Porter revela los desafíos y oportunidades matizadas que definen la resiliencia estratégica de SFST en un mercado de servicios financieros cada vez más competitivos.
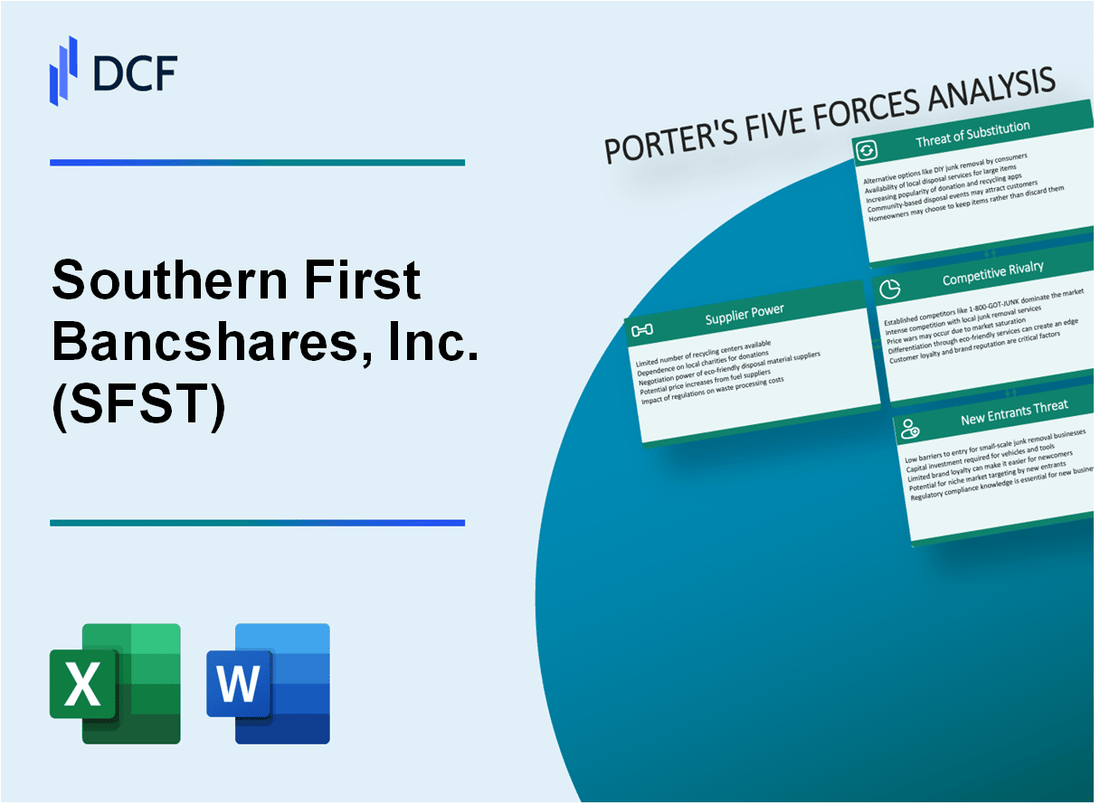
Southern First Bancshares, Inc. (SFST) - Las cinco fuerzas de Porter: poder de negociación de los proveedores
Core Banking Technology Providers Landscape
A partir de 2024, Southern First Bancshares se basa en un número limitado de proveedores de tecnología bancaria central. Jack Henry & Associates reportó $ 1.63 mil millones en ingresos totales para el año fiscal 2023. Fiserv, otro proveedor clave, generó $ 15.8 mil millones en ingresos en 2023.
| Proveedor de tecnología bancaria central | Ingresos anuales 2023 | Cuota de mercado |
|---|---|---|
| Jack Henry & Asociado | $ 1.63 mil millones | 22.5% |
| Fiserv | $ 15.8 mil millones | 35.7% |
| FIS Global | $ 14.2 mil millones | 29.3% |
Cambiar costos y restricciones de infraestructura
Los costos de migración del sistema bancario central oscilan entre $ 500,000 y $ 5 millones para bancos medianos como Southern First Bancshares.
- Tiempo de implementación promedio: 12-18 meses
- Gastos de integración técnica: $ 250,000 - $ 750,000
- Costos de capacitación del personal: $ 100,000 - $ 300,000
Requisitos de tecnología regulatoria
El gasto en el software de cumplimiento en el sector bancario alcanzó los $ 131 mil millones a nivel mundial en 2023, con una tasa de crecimiento anual estimada del 15-20%.
| Área de cumplimiento regulatorio | Gasto anual promedio |
|---|---|
| Ciberseguridad | $ 45 millones |
| Anti-lavado de dinero | $ 32 millones |
| Privacidad de datos | $ 22 millones |
Southern First Bancshares, Inc. (SFST) - Las cinco fuerzas de Porter: poder de negociación de los clientes
Opciones moderadas de conmutación de clientes en el mercado bancario regional
A partir del cuarto trimestre de 2023, Southern First Bancshares reportó 12 lugares bancarios en Carolina del Sur y Georgia. Costos de cambio de cliente estimados en aproximadamente $ 150- $ 300 por transferencia de cuenta.
| Métrico de mercado | Valor |
|---|---|
| Ubicaciones bancarias regionales | 12 |
| Costo de transferencia de cuenta estimado | $150-$300 |
| Tasa promedio de retención de clientes | 87.3% |
Aumento de las expectativas del cliente para los servicios de banca digital
La tasa de adopción de la banca digital para los clientes de SFST alcanzó el 68.4% en 2023, con un uso de la banca móvil en un 22.7% año tras año.
- Usuarios de banca móvil: 68.4%
- Volumen de transacciones en línea: 1.2 millones de transacciones mensuales
- Tasa de satisfacción de la plataforma digital: 84.5%
Tasas de interés competitivas y estructuras de tarifas
Tasa de interés promedio de la cuenta de ahorro de SFST: 0.45%, tarifas de cuenta corriente: $ 8.50 mensuales.
| Tipo de cuenta | Tasa de interés | Tarifa mensual |
|---|---|---|
| Cuenta de ahorros | 0.45% | $0 |
| Cuenta de cheques | 0.01% | $8.50 |
Enfoque bancario basado en relaciones en los mercados del sureste
Valor promedio de la relación con el cliente: $ 24,500, con el 62.3% de los clientes que poseen múltiples productos bancarios.
- Porcentaje del cliente de productos múltiples: 62.3%
- Valor promedio de relación con el cliente: $ 24,500
- Participación del programa de fidelización del cliente: 41.7%
Southern First Bancshares, Inc. (SFST) - Las cinco fuerzas de Porter: rivalidad competitiva
Panorama competitivo bancario regional
A partir del cuarto trimestre de 2023, Southern First Bancshares enfrenta la competencia de 37 bancos regionales y comunitarios en el sureste de los Estados Unidos.
| Competidor | Activos totales | Cuota de mercado |
|---|---|---|
| First Horizon National Corporation | $ 87.4 mil millones | 4.2% |
| Corporación financiera de Truist | $ 545 mil millones | 12.7% |
| Corporación del Estado Sur | $ 34.6 mil millones | 2.1% |
Estrategias competitivas
Las estrategias de diferenciación competitiva de SFST incluyen:
- Servicios bancarios personalizados dirigidos a empresas pequeñas a medianas
- Inversiones de plataforma de banca digital
- Gestión localizada de relaciones con el cliente
Inversión bancaria digital
En 2023, SFST invirtió $ 3.2 millones en mejoras de plataformas de banca digital, lo que representa un aumento del 22% de 2022.
| Categoría de inversión digital | 2023 Gastos |
|---|---|
| Desarrollo de aplicaciones de banca móvil | $ 1.4 millones |
| Actualizaciones de ciberseguridad | $ 1.1 millones |
| Infraestructura bancaria en línea | $700,000 |
Impacto de consolidación del mercado
La consolidación del sector bancario aumentó en un 7,3% en 2023, con 18 transacciones de fusión y adquisición en la región sureste.
Southern First Bancshares, Inc. (SFST) - Las cinco fuerzas de Porter: amenaza de sustitutos
Cultivo de fintech y alternativas de banca en línea
A partir de 2024, el tamaño del mercado bancario en línea alcanzó los $ 13.2 mil millones a nivel mundial. Empresas de FinTech como PayPal, Chime y Sofi han capturado el 12.3% de los clientes bancarios tradicionales. Las plataformas de banca digital experimentaron un crecimiento del 27.4% en la adopción del usuario en comparación con 2023.
| Plataforma fintech | Usuarios activos | Cuota de mercado |
|---|---|---|
| Paypal | 435 millones | 48.5% |
| Repicar | 14.5 millones | 5.2% |
| Sofi | 6.2 millones | 2.8% |
Aparición de plataformas de pago digital
Las plataformas de pago digital procesaron $ 9.46 billones en transacciones en 2024. El volumen de pago móvil aumentó en un 22.7% año tras año.
- Apple Pay: 507 millones de usuarios en todo el mundo
- Google Pay: 391 millones de usuarios
- Samsung Pay: 286 millones de usuarios
Aumento de las tecnologías de banca móvil y billetera digital
La adopción de la banca móvil alcanzó el 89.4% entre los Millennials y los consumidores de la Generación Z. Las transacciones de billetera digital totalizaron $ 4.8 billones en 2024.
| Billetera digital | Volumen de transacción | Base de usuarios |
|---|---|---|
| Venmo | $ 236 mil millones | 82 millones |
| Aplicación en efectivo | $ 192 mil millones | 44 millones |
Criptomonedas y posibles interrupciones de blockchain
La capitalización del mercado de criptomonedas alcanzó los $ 2.3 billones en 2024. La integración de tecnología de blockchain en servicios financieros aumentó en un 37.5%.
- Bitcoin Market Cap: $ 1.2 billones
- Ethereum Market Cap: $ 412 mil millones
- Blockchain Financial Services Inversión: $ 22.5 mil millones
Southern First Bancshares, Inc. (SFST) - Las cinco fuerzas de Porter: amenaza de nuevos participantes
Barreras regulatorias en la entrada del mercado bancario
Southern First Bancshares enfrenta barreras regulatorias significativas que limitan sustancialmente los nuevos participantes del mercado. A partir de 2024, la Reserva Federal requiere:
| Requisito regulatorio | Umbral mínimo |
|---|---|
| Relación de capital mínimo de nivel 1 | 8% |
| Relación de capital basada en el riesgo total | 10.5% |
| Relación de apalancamiento | 5% |
Requisitos de capital para nuevos establecimientos bancarios
Establecer un nuevo banco requiere recursos financieros sustanciales:
- Requisito de capital inicial: $ 10-20 millones
- Financiación inicial mínima: $ 15.7 millones
- Costos de configuración de cumplimiento regulatorio: $ 1.2-2.5 millones
Procesos de cumplimiento y licencia
La nueva formación bancaria implica requisitos de procedimiento complejos:
| Paso de cumplimiento | Tiempo de procesamiento promedio |
|---|---|
| Revisión inicial de la aplicación | 12-18 meses |
| Verificación de antecedentes | 3-6 meses |
| Proceso de aprobación final | 6-9 meses |
Presencia del mercado de bancos regionales existentes
Southern First Bancshares 'Market Posicioning:
- Activos totales: $ 6.8 mil millones
- Cuota de mercado en Carolina del Sur: 4.3%
- Número de ramas: 37
- Retorno sobre el patrimonio (ROE): 12.7%
Southern First Bancshares, Inc. (SFST) - Porter's Five Forces: Competitive rivalry
You're looking at the competitive intensity in the Southeastern US banking space, and honestly, it's fierce. Southern First Bancshares, Inc. operates right in the middle of it, competing across South Carolina, North Carolina, and Georgia. This isn't a quiet pond; it's a crowded, dynamic market where growth is the name of the game for everyone.
The rivalry is definitely high because every regional player, big or small, is laser-focused on the same dual goals: driving high-quality loan growth and expanding their net interest margin (NIM). For Southern First Bancshares, Inc., this means every new commercial relationship or mortgage application is a direct contest against better-capitalized, larger banks.
Consider the scale difference. Southern First Bancshares, Inc. is classified as a micro-cap bank, reporting total assets of $4.4 Billion as of Q3 2025. That puts it in a different league when squaring off against established giants in the same footprint. To give you a concrete example of the disparity you're facing, look at the asset bases of some of the major regional players:
| Bank Name | Total Assets (Q3 2025) | Asset Size Category |
|---|---|---|
| Southern First Bancshares, Inc. (SFST) | $4.4 Billion | Micro-Cap |
| Regions Financial Corporation (RF) | $159.940 Billion | Large Regional |
| Truist Financial Corporation (TFC) | $544 Billion | Major Regional/Super-Regional |
That table shows you the immediate challenge. When you're competing for the same high-value commercial client in Atlanta or Charlotte, the sheer balance sheet size of competitors like Truist Financial Corporation, with $544 Billion in assets, or Regions Financial Corporation, with $159.940 Billion in assets, changes the dynamic significantly.
Still, Southern First Bancshares, Inc. has carved out a competitive edge through discipline, which is a key differentiator when everyone is chasing growth. The bank's focus on superior asset quality acts as a shield against the aggressive lending that can sometimes accompany high rivalry. You can see this strength clearly in their Q3 2025 metrics:
- Nonperforming Assets (NPAs) to total assets: 0.27%.
- Net charge-offs (NCOs): 0.00%.
- Total Loans: $3.8 Billion.
- Core Deposits: $2.9 Billion.
- Net Interest Margin (NIM): 2.62%.
This focus on quality over quantity in lending, while maintaining a healthy NIM of 2.62%, is what allows the bank to compete effectively on relationship banking rather than just rate wars. It helps support strong profitability metrics, like the diluted EPS of $1.07 in Q3 2025, and a book value per common share of $43.51. The rivalry is intense, but Southern First Bancshares, Inc.'s asset quality is definitely a competitive strength you need to track.
Southern First Bancshares, Inc. (SFST) - Porter's Five Forces: Threat of substitutes
The threat of substitutes for Southern First Bancshares, Inc. remains a persistent factor, as various non-bank entities and alternative investment vehicles directly compete for both lending volume and core deposit funding. You need to watch these closely because they chip away at both sides of the balance sheet.
Non-bank mortgage lenders substitute a core product, as mortgage banking is a key noninterest income contributor.
The mortgage origination space is heavily dominated by non-bank entities, which directly pressures the fee income Southern First Bancshares, Inc. generates from its mortgage banking activities. For instance, in the first quarter of 2025, the nonbank share of total originations climbed to 66.4%, up from 65.2% in 2024. To put the scale in perspective, non-bank financial institutions accounted for 17 of the top 25 mortgage lenders in the U.S. by originations in 2024. While Southern First Bancshares, Inc. reported mortgage banking income of $1.6 million in fee revenue for the third quarter of 2025, this segment is constantly under threat from these larger, more specialized players. Total mortgage originations are forecast to reach $1.9 trillion in 2025, a market where nonbanks are expected to capture the majority share.
Financial Technology (FinTech) firms offer highly efficient, low-cost alternatives for payments and lending services.
FinTechs are not just a threat to traditional banking infrastructure; they are a massive, growing market segment. The U.S. Digital Lending Market was valued at $303.07 billion in 2025. Furthermore, the broader U.S. Fintech Market size was projected to reach $97.8 billion in 2025, up from $85.7 billion in 2024. These firms use AI and ML, which held a 35.6% market share in 2024 within the fintech technology segment, to offer speed and efficiency that can pull both loan originations and payment processing away from established banks.
Large brokerage houses and money market funds substitute deposits by offering higher yields on liquid assets.
For Southern First Bancshares, Inc.'s deposit base-which stood at $2.9 billion in core deposits as of Q3 2025-the primary substitute threat comes from liquid, higher-yielding investments. Money market funds (MMFs) are a major draw, with total U.S. MMF assets reaching $7 trillion in 2024. While the national average money market account (MMA) yield was only 0.44% APY as of mid-November 2025, the best online MMAs were offering rates up to 4.25% APY. The US Money Market Treasury Yield was 3.86% in November 2025. This wide gap between the average bank deposit rate and the top alternative yields creates a constant incentive for clients to move funds out of traditional accounts, directly challenging Southern First Bancshares, Inc.'s funding stability.
Credit unions and community development financial institutions (CDFIs) offer tax-advantaged, localized competition.
Localized competition is fierce, especially given Southern First Bancshares, Inc.'s focus on Southeastern markets. Credit unions, which operate as member-owned cooperatives driven by service rather than profit, offer a structural advantage through tax-exempt status. Nationally, the Credit Unions industry market size was $147.4 billion in 2025. Specifically in one of Southern First Bancshares, Inc.'s key states, the Credit Unions industry market size in South Carolina was $1.4 billion in 2025. The competitive landscape in the Carolinas is evident, as 11 credit unions across North Carolina and South Carolina were recognized on Forbes' 2025 list of America's Best-In-State Credit Unions.
Here's a quick look at the scale of these substitute threats:
| Substitute Category | Relevant 2025 Metric | Value/Amount |
|---|---|---|
| Non-Bank Mortgage Lenders | Share of Total Originations (Q1 2025) | 66.4% |
| FinTech Lending | U.S. Digital Lending Market Size (2025 Estimate) | $303.07 billion |
| Money Market Funds (MMFs) | U.S. MMF Assets (2024) | $7 trillion |
| Best MMA Yield (Nov 2025) | Top Money Market Account APY | 4.25% |
| Credit Unions (SC Market) | Industry Market Size in South Carolina (2025) | $1.4 billion |
Finance: review the current average rate paid on SFST's core deposits versus the 3.86% US Money Market Treasury Yield as of November 2025 by next Tuesday.
Southern First Bancshares, Inc. (SFST) - Porter's Five Forces: Threat of new entrants
The threat of new entrants for Southern First Bancshares, Inc. remains moderate. Honestly, starting a new bank from scratch-a de novo institution-is incredibly tough because of the sector's inherent structure. You're facing high capital requirements just to get the doors open, plus the sheer weight of regulatory compliance. These factors definitely act as a significant moat for established players like Southern First Bancshares, Inc.
Still, the bank's chosen turf keeps the pressure on. Southern First Bancshares, Inc. operates across high-growth Southeastern markets, including Greenville, Columbia, and Charleston in South Carolina; Charlotte, Raleigh, and Greensboro in North Carolina; and Atlanta, Georgia. These areas are magnets for capital, continually drawing both new de novo banks and expansion efforts from existing regional banks looking to plant a flag where the economy is booming. For instance, South Carolina posted the fastest-growing GDP in the nation at the start of this year, which is a huge draw. It means new competitors are always looking for a way in.
Southern First Bancshares, Inc. benefits from a soft barrier built on time and trust. The bank has a 25-year history, having been established in 1999. Those years build deep, local relationships that are hard for non-local entrants to replicate quickly. You can't just buy that kind of local knowledge; you have to earn it client by client. That relationship-focused approach, which they call the ClientFIRST model, is a key differentiator against a purely digital or distant competitor.
The regulatory compliance costs for new entrants are substantial, which helps protect the incumbent's capital position. Southern First Bancshares, Inc. maintains a strong buffer, reporting a Common Equity Tier 1 (CET1) capital ratio of 10.9% as of the latest required reporting period. This level of capitalization is a direct result of disciplined operations and provides a solid foundation against new, less capitalized competition. Here's a quick look at the scale and performance that new entrants would need to match in these attractive markets:
| Metric (As of Q3 2025) | Southern First Bancshares, Inc. (SFST) | Peer Average (Community Banks) | National Average (Banks of Similar Size) |
|---|---|---|---|
| Total Assets | $4.4 Billion | Data Unavailable | Data Unavailable |
| Total Loans | $3.8 Billion | Data Unavailable | Data Unavailable |
| Core Deposits | $2.9 Billion | Data Unavailable | Data Unavailable |
| Net Interest Margin (NIM) | 2.62% | Data Unavailable | NIM was 124 basis points higher than the national average in Q2 2025 |
| Return on Average Assets (ROAA) | 0.80% | Data Unavailable | 1.21% (Q2 2025) |
The difference in ROAA between Southern First Bancshares, Inc. at 0.80% and the national average of 1.21% in Q2 2025 shows that while the markets are attractive, operational efficiency for new entrants must be top-tier to compete immediately. Plus, the regulatory hurdle itself is a major cost center.
- High initial capital requirements are a primary deterrent.
- Regulatory compliance costs are substantial for startups.
- SFST's Tier 1 RBC was 11.26% in Q3 2025, showing strong capital backing.
- Geographic footprint covers high-growth metros in SC, NC, and GA.
- SFST has 25 years of established local market presence.
Finance: review the capital expenditure budget for Q1 2026 by end of next week.
Disclaimer
All information, articles, and product details provided on this website are for general informational and educational purposes only. We do not claim any ownership over, nor do we intend to infringe upon, any trademarks, copyrights, logos, brand names, or other intellectual property mentioned or depicted on this site. Such intellectual property remains the property of its respective owners, and any references here are made solely for identification or informational purposes, without implying any affiliation, endorsement, or partnership.
We make no representations or warranties, express or implied, regarding the accuracy, completeness, or suitability of any content or products presented. Nothing on this website should be construed as legal, tax, investment, financial, medical, or other professional advice. In addition, no part of this site—including articles or product references—constitutes a solicitation, recommendation, endorsement, advertisement, or offer to buy or sell any securities, franchises, or other financial instruments, particularly in jurisdictions where such activity would be unlawful.
All content is of a general nature and may not address the specific circumstances of any individual or entity. It is not a substitute for professional advice or services. Any actions you take based on the information provided here are strictly at your own risk. You accept full responsibility for any decisions or outcomes arising from your use of this website and agree to release us from any liability in connection with your use of, or reliance upon, the content or products found herein.