
|
Valoración DCF de Shore Bancshares, Inc. (SHBI) |
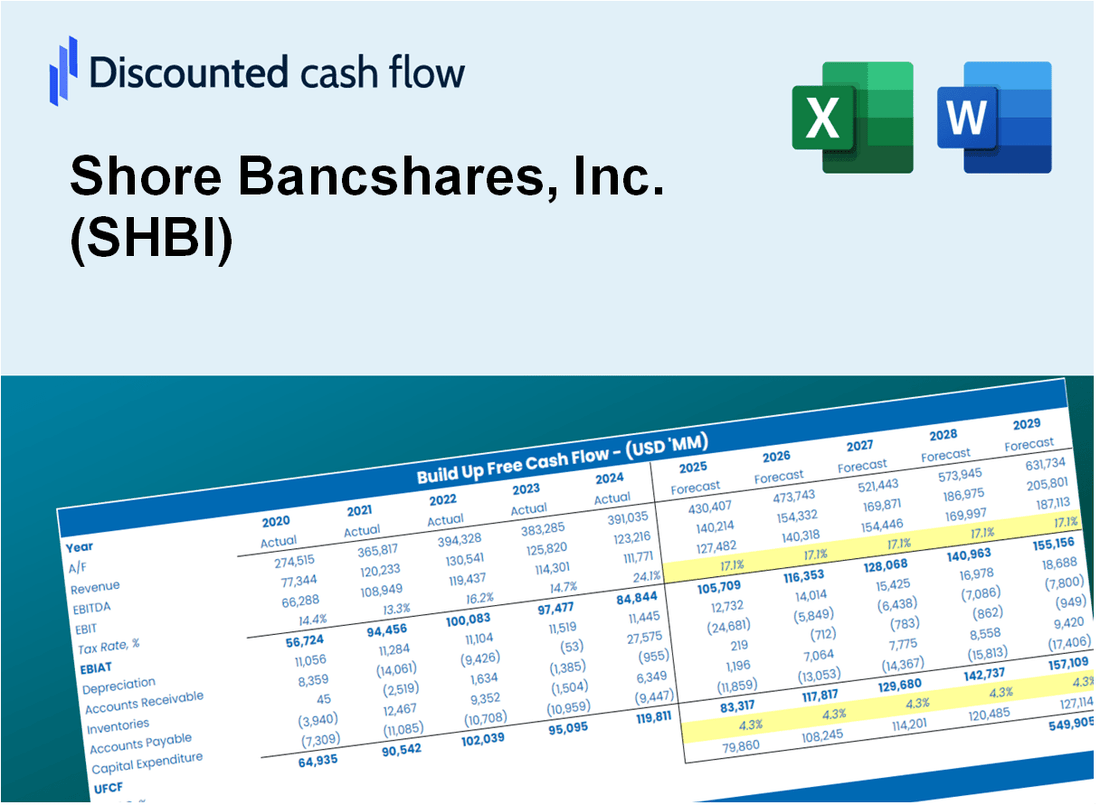
Completamente Editable: Adáptelo A Sus Necesidades En Excel O Sheets
Diseño Profesional: Plantillas Confiables Y Estándares De La Industria
Predeterminadas Para Un Uso Rápido Y Eficiente
Compatible con MAC / PC, completamente desbloqueado
No Se Necesita Experiencia; Fáciles De Seguir
Shore Bancshares, Inc. (SHBI) Bundle
¡Explore las perspectivas financieras de Shore Bancshares, Inc. (SHBI) con nuestra calculadora DCF fácil de usar! Ingrese sus proyecciones para el crecimiento, los márgenes y los gastos para calcular el valor intrínseco de Shore Bancshares, Inc. (SHBI) y mejorar su estrategia de inversión.
What You Will Get
- Pre-Filled Financial Model: Shore Bancshares, Inc.'s (SHBI) actual data allows for accurate DCF valuation.
- Full Forecast Control: Modify revenue growth, profit margins, WACC, and other essential drivers.
- Instant Calculations: Real-time updates ensure you receive immediate results as you adjust inputs.
- Investor-Ready Template: A polished Excel file crafted for high-quality valuation presentations.
- Customizable and Reusable: Designed for adaptability, enabling repeated use for comprehensive forecasts.
Key Features
- Comprehensive Shore Bancshares Financials: Gain access to precise pre-loaded historical data and future forecasts for Shore Bancshares, Inc. (SHBI).
- Adjustable Forecast Inputs: Modify highlighted cells for key metrics such as WACC, growth rates, and profit margins.
- Real-Time Calculations: Enjoy automatic updates for DCF, Net Present Value (NPV), and cash flow assessments.
- User-Friendly Dashboard: Clear and informative charts and summaries to help you visualize valuation outcomes.
- Suitable for All Users: An intuitive design tailored for investors, CFOs, and consultants, regardless of experience level.
How It Works
- 1. Access the Template: Download and open the Excel file featuring Shore Bancshares, Inc.'s preloaded data.
- 2. Modify Assumptions: Adjust key inputs such as growth rates, WACC, and capital expenditures.
- 3. View Results Instantly: The DCF model automatically calculates intrinsic value and NPV.
- 4. Explore Scenarios: Analyze various forecasts to evaluate different valuation outcomes.
- 5. Present with Confidence: Share professional valuation insights to inform your decisions.
Why Choose This Calculator for Shore Bancshares, Inc. (SHBI)?
- Designed for Experts: A sophisticated tool utilized by financial analysts, CFOs, and consultants.
- Accurate Data: Shore Bancshares' historical and projected financials are preloaded for precision.
- Forecast Scenarios: Effortlessly simulate various forecasts and assumptions.
- Comprehensive Outputs: Automatically computes intrinsic value, NPV, and essential metrics.
- User-Friendly: Step-by-step guidance to navigate the calculation process.
Who Should Use Shore Bancshares, Inc. (SHBI)?
- Professional Investors: Develop comprehensive valuation models for informed investment decisions.
- Corporate Finance Teams: Evaluate financial scenarios to shape strategic initiatives within the organization.
- Consultants and Advisors: Deliver precise valuation assessments to clients interested in Shore Bancshares, Inc. (SHBI).
- Students and Educators: Utilize current market data to enhance learning in financial modeling and analysis.
- Banking and Finance Enthusiasts: Gain insights into the valuation processes of regional banks like Shore Bancshares, Inc. (SHBI).
What the Template Contains
- Pre-Filled Data: Includes Shore Bancshares, Inc.'s historical financials and forecasts.
- Discounted Cash Flow Model: Editable DCF valuation model with automatic calculations.
- Weighted Average Cost of Capital (WACC): A dedicated sheet for calculating WACC based on custom inputs.
- Key Financial Ratios: Analyze Shore Bancshares, Inc.'s profitability, efficiency, and leverage.
- Customizable Inputs: Edit revenue growth, margins, and tax rates with ease.
- Clear Dashboard: Charts and tables summarizing key valuation results.
Disclaimer
All information, articles, and product details provided on this website are for general informational and educational purposes only. We do not claim any ownership over, nor do we intend to infringe upon, any trademarks, copyrights, logos, brand names, or other intellectual property mentioned or depicted on this site. Such intellectual property remains the property of its respective owners, and any references here are made solely for identification or informational purposes, without implying any affiliation, endorsement, or partnership.
We make no representations or warranties, express or implied, regarding the accuracy, completeness, or suitability of any content or products presented. Nothing on this website should be construed as legal, tax, investment, financial, medical, or other professional advice. In addition, no part of this site—including articles or product references—constitutes a solicitation, recommendation, endorsement, advertisement, or offer to buy or sell any securities, franchises, or other financial instruments, particularly in jurisdictions where such activity would be unlawful.
All content is of a general nature and may not address the specific circumstances of any individual or entity. It is not a substitute for professional advice or services. Any actions you take based on the information provided here are strictly at your own risk. You accept full responsibility for any decisions or outcomes arising from your use of this website and agree to release us from any liability in connection with your use of, or reliance upon, the content or products found herein.