
|
Shaftesbury Capital Plc (SHC.L) DCF Valoración |
Completamente Editable: Adáptelo A Sus Necesidades En Excel O Sheets
Diseño Profesional: Plantillas Confiables Y Estándares De La Industria
Predeterminadas Para Un Uso Rápido Y Eficiente
Compatible con MAC / PC, completamente desbloqueado
No Se Necesita Experiencia; Fáciles De Seguir
Shaftesbury Capital PLC (SHC.L) Bundle
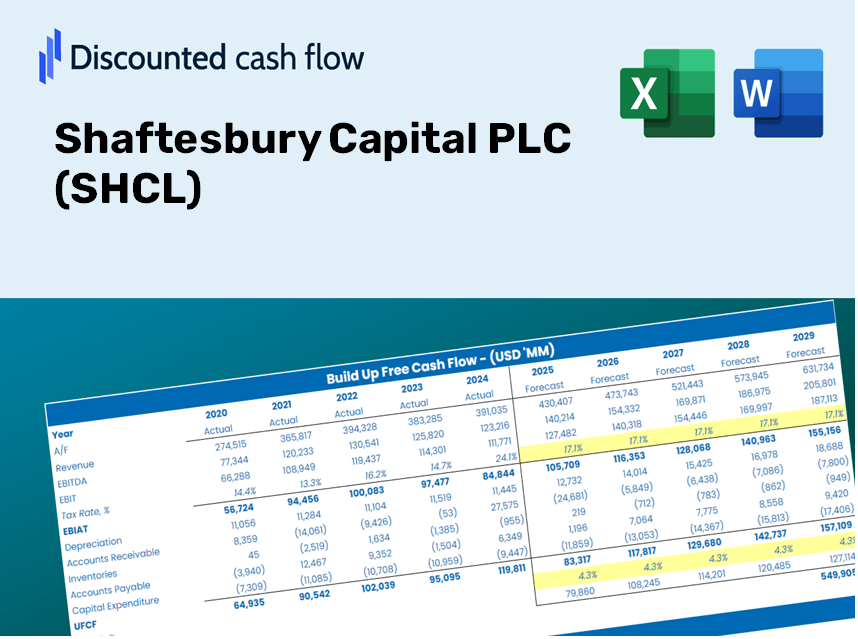
Diseñada para la precisión, nuestra calculadora DCF de Shaftesbury Capital PLC (SHCL) le permite evaluar la valoración de Shaftesbury Capital PLC con datos financieros del mundo real y la flexibilidad para modificar todos los parámetros esenciales para las proyecciones mejoradas.
Discounted Cash Flow (DCF) - (USD MM)
| Year | AY1 2020 |
AY2 2021 |
AY3 2022 |
AY4 2023 |
AY5 2024 |
FY1 2025 |
FY2 2026 |
FY3 2027 |
FY4 2028 |
FY5 2029 |
|---|---|---|---|---|---|---|---|---|---|---|
| Revenue | 72.9 | 75.3 | 87.6 | 198.0 | 227.1 | 303.4 | 405.2 | 541.3 | 723.1 | 965.9 |
| Revenue Growth, % | 0 | 3.29 | 16.33 | 126.03 | 14.7 | 33.58 | 33.58 | 33.58 | 33.58 | 33.58 |
| EBITDA | 28.3 | 73.4 | -175.3 | 818.6 | 324.7 | 143.4 | 191.5 | 255.8 | 341.7 | 456.5 |
| EBITDA, % | 38.82 | 97.48 | -200.11 | 413.43 | 142.98 | 47.26 | 47.26 | 47.26 | 47.26 | 47.26 |
| Depreciation | 1.5 | 6.2 | .2 | .4 | .7 | 6.7 | 8.9 | 11.9 | 16.0 | 21.3 |
| Depreciation, % | 2.06 | 8.23 | 0.22831 | 0.20202 | 0.30823 | 2.21 | 2.21 | 2.21 | 2.21 | 2.21 |
| EBIT | 26.8 | 67.2 | -175.5 | 818.2 | 324.0 | 137.1 | 183.2 | 244.7 | 326.8 | 436.6 |
| EBIT, % | 36.76 | 89.24 | -200.34 | 413.23 | 142.67 | 45.2 | 45.2 | 45.2 | 45.2 | 45.2 |
| Total Cash | 365.1 | 331.1 | 129.9 | 208.5 | 109.8 | 272.0 | 363.4 | 485.4 | 648.4 | 866.1 |
| Total Cash, percent | .0 | .0 | .0 | .0 | .0 | .0 | .0 | .0 | .0 | .0 |
| Account Receivables | 65.7 | 48.4 | 20.8 | 13.6 | 30.4 | 120.4 | 160.8 | 214.8 | 286.9 | 383.3 |
| Account Receivables, % | 90.12 | 64.28 | 23.74 | 6.87 | 13.39 | 39.68 | 39.68 | 39.68 | 39.68 | 39.68 |
| Inventories | .0 | .0 | .0 | .0 | .0 | .0 | .0 | .0 | .0 | .0 |
| Inventories, % | 0 | 0 | 0 | 0 | 0 | 0 | 0 | 0 | 0 | 0 |
| Accounts Payable | .0 | .0 | .0 | .0 | 84.8 | 22.7 | 30.3 | 40.4 | 54.0 | 72.1 |
| Accounts Payable, % | 0 | 0 | 0 | 0 | 37.34 | 7.47 | 7.47 | 7.47 | 7.47 | 7.47 |
| Capital Expenditure | -23.9 | -7.9 | -11.1 | -3.4 | -2.3 | -35.6 | -47.6 | -63.5 | -84.9 | -113.4 |
| Capital Expenditure, % | -32.78 | -10.49 | -12.67 | -1.72 | -1.01 | -11.74 | -11.74 | -11.74 | -11.74 | -11.74 |
| Tax Rate, % | 0.11886 | 0.11886 | 0.11886 | 0.11886 | 0.11886 | 0.11886 | 0.11886 | 0.11886 | 0.11886 | 0.11886 |
| EBITAT | 26.8 | 65.9 | -180.6 | 818.0 | 323.6 | 136.5 | 182.3 | 243.6 | 325.4 | 434.6 |
| Depreciation | ||||||||||
| Changes in Account Receivables | ||||||||||
| Changes in Inventories | ||||||||||
| Changes in Accounts Payable | ||||||||||
| Capital Expenditure | ||||||||||
| UFCF | -61.3 | 81.5 | -163.9 | 822.2 | 390.0 | -44.5 | 110.9 | 148.2 | 197.9 | 264.4 |
| WACC, % | 7.04 | 7.01 | 7.04 | 7.04 | 7.04 | 7.03 | 7.03 | 7.03 | 7.03 | 7.03 |
| PV UFCF | ||||||||||
| SUM PV UFCF | 515.0 | |||||||||
| Long Term Growth Rate, % | 2.00 | |||||||||
| Free cash flow (T + 1) | 270 | |||||||||
| Terminal Value | 5,357 | |||||||||
| Present Terminal Value | 3,813 | |||||||||
| Enterprise Value | 4,328 | |||||||||
| Net Debt | 1,361 | |||||||||
| Equity Value | 2,967 | |||||||||
| Diluted Shares Outstanding, MM | 1,828 | |||||||||
| Equity Value Per Share | 162.31 |
What You Will Receive
- Genuine Shaftesbury Data: Preloaded financial metrics – from revenue to EBIT – reflecting actual and projected figures.
- Comprehensive Customization: Modify all essential parameters (yellow cells) such as WACC, growth %, and tax rates.
- Instant Valuation Adjustments: Automatic recalibrations to assess how changes affect the fair value of Shaftesbury Capital PLC (SHCL).
- Flexible Excel Template: Designed for quick edits, scenario analysis, and in-depth forecasting.
- Efficient and Accurate: Avoid the hassle of building models from the ground up while ensuring accuracy and adaptability.
Key Features
- Real-Time SHCL Data: Pre-loaded with Shaftesbury Capital PLC's historical financial data and future projections.
- Completely Customizable Inputs: Modify revenue growth rates, profit margins, WACC, tax rates, and capital expenditures to fit your analysis.
- Adaptive Valuation Model: Automatically recalculates Net Present Value (NPV) and intrinsic value according to your specified inputs.
- Scenario Analysis: Generate multiple forecasting scenarios to evaluate varying valuation results.
- Intuitive User Interface: Streamlined and organized for both professional users and newcomers.
How It Works
- Step 1: Download the Excel file.
- Step 2: Examine the pre-filled Shaftesbury Capital PLC (SHCL) data (historical and projected).
- Step 3: Modify key assumptions (yellow cells) according to your insights.
- Step 4: Observe automatic recalculations for Shaftesbury Capital PLC’s intrinsic value.
- Step 5: Utilize the results for investment decisions or reporting.
Why Opt for This Calculator?
- All-in-One Solution: Combines DCF, WACC, and financial ratio analyses for a complete assessment.
- Flexible Inputs: Modify the yellow-highlighted cells to explore different scenarios.
- In-Depth Analysis: Automatically determines Shaftesbury Capital PLC’s intrinsic value and Net Present Value.
- Preloaded Information: Historical and projected data provide reliable starting points.
- High-Quality Standards: Perfect for financial analysts, investors, and business consultants.
Who Can Benefit from Using This Product?
- Investors: Evaluate Shaftesbury Capital PLC’s (SHCL) valuation before making stock transactions.
- CFOs and Financial Analysts: Optimize valuation processes and assess projections with ease.
- Startup Founders: Gain insights into the valuation methods used for prominent companies like Shaftesbury Capital PLC.
- Consultants: Create comprehensive valuation reports for your clients.
- Students and Educators: Access real-world data to practice and teach effective valuation strategies.
Contents of the Template
- Pre-Filled Data: Features Shaftesbury Capital PLC's historical financial performance and projections.
- Discounted Cash Flow Model: Interactive DCF valuation model with automatic computation.
- Weighted Average Cost of Capital (WACC): A specialized sheet for calculating WACC using custom parameters.
- Key Financial Ratios: Evaluate Shaftesbury Capital PLC's profitability, efficiency, and leverage.
- Customizable Inputs: Easily modify revenue growth, profit margins, and tax rates.
- Clear Dashboard: Visuals and tables that summarize essential valuation outcomes.
Disclaimer
All information, articles, and product details provided on this website are for general informational and educational purposes only. We do not claim any ownership over, nor do we intend to infringe upon, any trademarks, copyrights, logos, brand names, or other intellectual property mentioned or depicted on this site. Such intellectual property remains the property of its respective owners, and any references here are made solely for identification or informational purposes, without implying any affiliation, endorsement, or partnership.
We make no representations or warranties, express or implied, regarding the accuracy, completeness, or suitability of any content or products presented. Nothing on this website should be construed as legal, tax, investment, financial, medical, or other professional advice. In addition, no part of this site—including articles or product references—constitutes a solicitation, recommendation, endorsement, advertisement, or offer to buy or sell any securities, franchises, or other financial instruments, particularly in jurisdictions where such activity would be unlawful.
All content is of a general nature and may not address the specific circumstances of any individual or entity. It is not a substitute for professional advice or services. Any actions you take based on the information provided here are strictly at your own risk. You accept full responsibility for any decisions or outcomes arising from your use of this website and agree to release us from any liability in connection with your use of, or reliance upon, the content or products found herein.