
|
Valoración de DCF de Shilpa Medicare Limited (shilpamed.ns) |
Completamente Editable: Adáptelo A Sus Necesidades En Excel O Sheets
Diseño Profesional: Plantillas Confiables Y Estándares De La Industria
Predeterminadas Para Un Uso Rápido Y Eficiente
Compatible con MAC / PC, completamente desbloqueado
No Se Necesita Experiencia; Fáciles De Seguir
Shilpa Medicare Limited (SHILPAMED.NS) Bundle
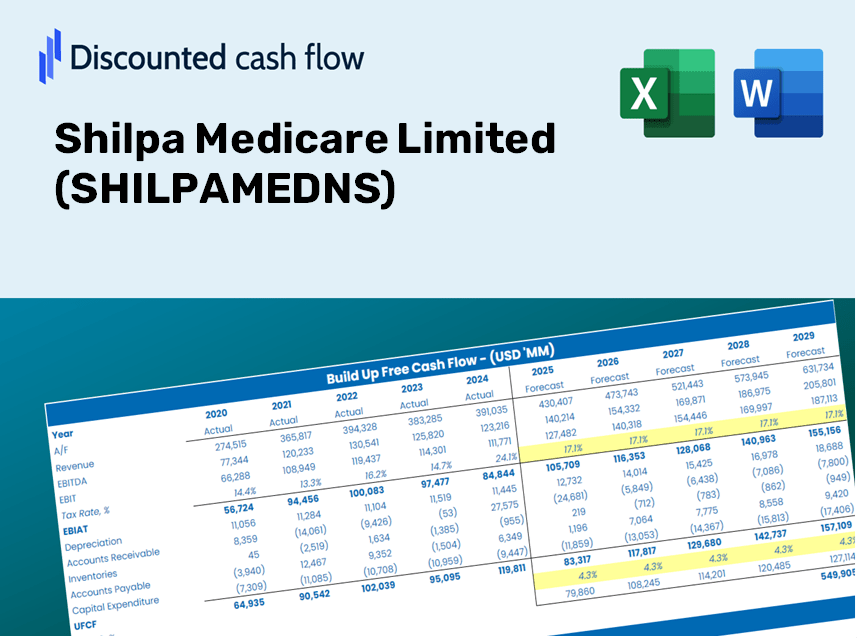
¡Obtenga información sobre su análisis de valoración Shilpa Medicare Limited (Shilpamedns) utilizando nuestra calculadora DCF de vanguardia! Esta plantilla de Excel viene precargada de datos reales (Shilpamedns), lo que le permite ajustar preventos y supuestos para determinar con precisión el valor intrínseco de Shilpa Medicare Limited.
Discounted Cash Flow (DCF) - (USD MM)
| Year | AY1 2021 |
AY2 2022 |
AY3 2023 |
AY4 2024 |
AY5 2025 |
FY1 2026 |
FY2 2027 |
FY3 2028 |
FY4 2029 |
FY5 2030 |
|---|---|---|---|---|---|---|---|---|---|---|
| Revenue | 9,001.6 | 11,400.5 | 10,434.5 | 11,531.1 | 12,864.1 | 14,158.5 | 15,583.0 | 17,150.9 | 18,876.6 | 20,775.9 |
| Revenue Growth, % | 0 | 26.65 | -8.47 | 10.51 | 11.56 | 10.06 | 10.06 | 10.06 | 10.06 | 10.06 |
| EBITDA | 2,726.3 | 2,268.9 | 1,134.7 | 2,459.4 | 3,108.6 | 3,017.4 | 3,321.0 | 3,655.1 | 4,022.9 | 4,427.6 |
| EBITDA, % | 30.29 | 19.9 | 10.87 | 21.33 | 24.16 | 21.31 | 21.31 | 21.31 | 21.31 | 21.31 |
| Depreciation | 539.8 | 798.0 | 955.0 | 1,078.7 | 1,129.9 | 1,140.8 | 1,255.6 | 1,381.9 | 1,521.0 | 1,674.0 |
| Depreciation, % | 6 | 7 | 9.15 | 9.35 | 8.78 | 8.06 | 8.06 | 8.06 | 8.06 | 8.06 |
| EBIT | 2,186.6 | 1,470.9 | 179.8 | 1,380.7 | 1,978.7 | 1,876.6 | 2,065.4 | 2,273.2 | 2,501.9 | 2,753.7 |
| EBIT, % | 24.29 | 12.9 | 1.72 | 11.97 | 15.38 | 13.25 | 13.25 | 13.25 | 13.25 | 13.25 |
| Total Cash | 1,228.5 | 338.3 | 221.9 | 302.3 | 585.6 | 733.8 | 807.7 | 888.9 | 978.4 | 1,076.8 |
| Total Cash, percent | .0 | .0 | .0 | .0 | .0 | .0 | .0 | .0 | .0 | .0 |
| Account Receivables | 2,175.0 | 4,546.8 | 3,243.5 | 3,920.5 | 4,408.4 | 4,626.9 | 5,092.4 | 5,604.8 | 6,168.7 | 6,789.4 |
| Account Receivables, % | 24.16 | 39.88 | 31.08 | 34 | 34.27 | 32.68 | 32.68 | 32.68 | 32.68 | 32.68 |
| Inventories | 3,168.4 | 3,552.4 | 3,198.2 | 3,449.3 | 3,479.3 | 4,359.9 | 4,798.6 | 5,281.4 | 5,812.8 | 6,397.6 |
| Inventories, % | 35.2 | 31.16 | 30.65 | 29.91 | 27.05 | 30.79 | 30.79 | 30.79 | 30.79 | 30.79 |
| Accounts Payable | 672.5 | 1,460.4 | 1,428.0 | 1,748.2 | 953.8 | 1,601.1 | 1,762.2 | 1,939.5 | 2,134.7 | 2,349.5 |
| Accounts Payable, % | 7.47 | 12.81 | 13.69 | 15.16 | 7.41 | 11.31 | 11.31 | 11.31 | 11.31 | 11.31 |
| Capital Expenditure | -3,542.4 | -3,318.3 | -2,266.7 | -1,845.6 | -2,436.3 | -3,543.2 | -3,899.7 | -4,292.1 | -4,723.9 | -5,199.3 |
| Capital Expenditure, % | -39.35 | -29.11 | -21.72 | -16.01 | -18.94 | -25.03 | -25.03 | -25.03 | -25.03 | -25.03 |
| Tax Rate, % | 36 | 36 | 36 | 36 | 36 | 36 | 36 | 36 | 36 | 36 |
| EBITAT | 1,656.6 | 872.5 | 152.8 | 809.9 | 1,266.3 | 1,286.3 | 1,415.7 | 1,558.2 | 1,715.0 | 1,887.5 |
| Depreciation | ||||||||||
| Changes in Account Receivables | ||||||||||
| Changes in Inventories | ||||||||||
| Changes in Accounts Payable | ||||||||||
| Capital Expenditure | ||||||||||
| UFCF | -6,016.8 | -3,615.6 | 466.1 | -564.8 | -1,352.4 | -1,567.9 | -1,971.5 | -2,169.9 | -2,388.2 | -2,628.5 |
| WACC, % | 4.94 | 4.78 | 5.03 | 4.77 | 4.82 | 4.87 | 4.87 | 4.87 | 4.87 | 4.87 |
| PV UFCF | ||||||||||
| SUM PV UFCF | -9,216.6 | |||||||||
| Long Term Growth Rate, % | 2.00 | |||||||||
| Free cash flow (T + 1) | -2,681 | |||||||||
| Terminal Value | -93,480 | |||||||||
| Present Terminal Value | -73,706 | |||||||||
| Enterprise Value | -82,922 | |||||||||
| Net Debt | 5,618 | |||||||||
| Equity Value | -88,540 | |||||||||
| Diluted Shares Outstanding, MM | 195 | |||||||||
| Equity Value Per Share | -454.62 |
What You Will Receive
- Comprehensive SHILPAMEDNS Financials: Access to both historical and projected data for precise valuation.
- Customizable Inputs: Adjust WACC, tax rates, revenue growth, and capital expenditures as needed.
- Real-Time Calculations: Intrinsic value and NPV are updated automatically.
- Scenario Evaluation: Analyze various scenarios to assess Shilpa Medicare Limited's future prospects.
- User-Friendly Interface: Designed for industry experts but easy enough for newcomers.
Key Features
- Real-Time SHILPAMEDNS Data: Pre-loaded with Shilpa Medicare's historical financials and future projections.
- Completely Customizable Inputs: Modify revenue growth rates, profit margins, WACC, tax rates, and capital expenditures as needed.
- Adaptive Valuation Model: Instant updates to Net Present Value (NPV) and intrinsic value based on your criteria.
- Scenario Analysis: Develop various forecast scenarios to explore different potential valuation results.
- User-Centric Design: Intuitive layout designed for both seasoned professionals and newcomers.
How It Works
- Step 1: Download the ready-to-use Excel template featuring Shilpa Medicare Limited's data.
- Step 2: Review the pre-populated sheets to familiarize yourself with the essential metrics.
- Step 3: Modify forecasts and assumptions in the editable yellow cells (WACC, growth, margins).
- Step 4: Instantly see the updated results, including Shilpa Medicare Limited's intrinsic value.
- Step 5: Use the outputs to make well-informed investment choices or create detailed reports.
Why Opt for This Calculator?
- Precision: Utilizes actual Shilpa Medicare Limited (SHILPAMEDNS) financials for reliable data.
- Adaptability: Tailored for users to explore and adjust inputs as needed.
- Efficiency: Eliminate the complexities of constructing a DCF model from the ground up.
- Expert-Level: Crafted with the accuracy and usability expected at the CFO level.
- Accessible: Designed for straightforward use, even for those lacking advanced financial modeling knowledge.
Who Can Benefit from This Product?
- Individual Investors: Make educated choices regarding the purchase or sale of Shilpa Medicare Limited (SHILPAMEDNS) stock.
- Financial Analysts: Enhance your valuation procedures with easy-to-use financial models tailored for Shilpa Medicare Limited (SHILPAMEDNS).
- Consultants: Provide clients with accurate and timely valuation insights related to Shilpa Medicare Limited (SHILPAMEDNS).
- Business Owners: Gain insights into how major companies like Shilpa Medicare Limited (SHILPAMEDNS) are valued to inform your own business strategies.
- Finance Students: Explore valuation methods using real-time data and case studies centered around Shilpa Medicare Limited (SHILPAMEDNS).
Contents of the Template
- Preloaded SHILPAMEDNS Data: Historical and projected financial metrics, including revenue, EBIT, and capital expenditures.
- DCF and WACC Models: Professional-grade worksheets for assessing intrinsic value and calculating Weighted Average Cost of Capital.
- Editable Inputs: Yellow-highlighted cells for customizing revenue growth, tax rates, and discount rates.
- Financial Statements: Detailed annual and quarterly financial information for in-depth analysis.
- Key Ratios: Profitability, leverage, and efficiency ratios for performance evaluation.
- Dashboard and Charts: Visual representations of valuation results and underlying assumptions.
Disclaimer
All information, articles, and product details provided on this website are for general informational and educational purposes only. We do not claim any ownership over, nor do we intend to infringe upon, any trademarks, copyrights, logos, brand names, or other intellectual property mentioned or depicted on this site. Such intellectual property remains the property of its respective owners, and any references here are made solely for identification or informational purposes, without implying any affiliation, endorsement, or partnership.
We make no representations or warranties, express or implied, regarding the accuracy, completeness, or suitability of any content or products presented. Nothing on this website should be construed as legal, tax, investment, financial, medical, or other professional advice. In addition, no part of this site—including articles or product references—constitutes a solicitation, recommendation, endorsement, advertisement, or offer to buy or sell any securities, franchises, or other financial instruments, particularly in jurisdictions where such activity would be unlawful.
All content is of a general nature and may not address the specific circumstances of any individual or entity. It is not a substitute for professional advice or services. Any actions you take based on the information provided here are strictly at your own risk. You accept full responsibility for any decisions or outcomes arising from your use of this website and agree to release us from any liability in connection with your use of, or reliance upon, the content or products found herein.