
|
Valoración DCF de Seanergy Maritime Holdings Corp. (SHIP) |
Completamente Editable: Adáptelo A Sus Necesidades En Excel O Sheets
Diseño Profesional: Plantillas Confiables Y Estándares De La Industria
Predeterminadas Para Un Uso Rápido Y Eficiente
Compatible con MAC / PC, completamente desbloqueado
No Se Necesita Experiencia; Fáciles De Seguir
Seanergy Maritime Holdings Corp. (SHIP) Bundle
¡Simplifique la valoración de Seanergy Maritime Holdings Corp. (barco) con esta calculadora DCF personalizable! Con Real Seanergy Maritime Holdings Corp. (barco) financieras y entradas de pronóstico ajustables, puede probar escenarios y descubrir el valor razonable de Seanergy Maritime Holdings Corp. (barco) en minutos.
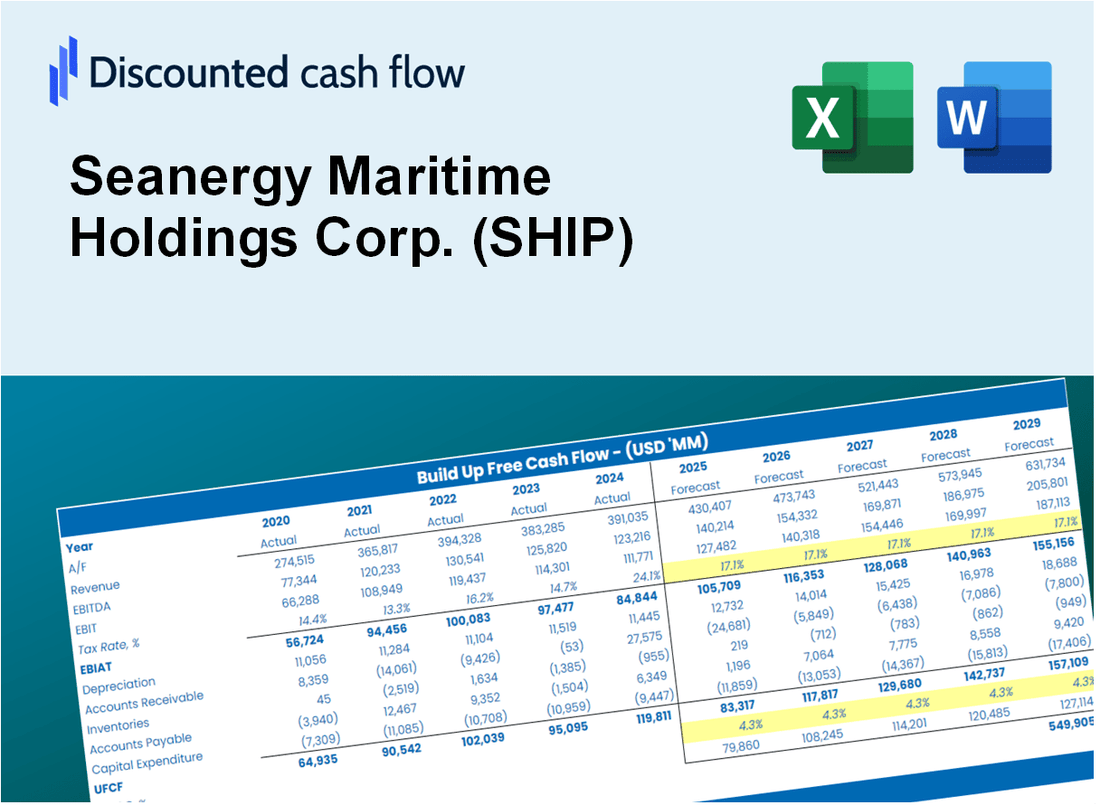
Discounted Cash Flow (DCF) - (USD MM)
| Year | AY1 2020 |
AY2 2021 |
AY3 2022 |
AY4 2023 |
AY5 2024 |
FY1 2025 |
FY2 2026 |
FY3 2027 |
FY4 2028 |
FY5 2029 |
|---|---|---|---|---|---|---|---|---|---|---|
| Revenue | 63.3 | 153.1 | 125.0 | 110.2 | 167.5 | 218.4 | 284.9 | 371.6 | 484.7 | 632.2 |
| Revenue Growth, % | 0 | 141.7 | -18.35 | -11.83 | 51.91 | 30.44 | 30.44 | 30.44 | 30.44 | 30.44 |
| EBITDA | 17.8 | 79.1 | 60.8 | 45.2 | 92.4 | 98.1 | 128.0 | 166.9 | 217.8 | 284.0 |
| EBITDA, % | 28.08 | 51.64 | 48.66 | 41.02 | 55.21 | 44.92 | 44.92 | 44.92 | 44.92 | 44.92 |
| Depreciation | 12.7 | 19.9 | 28.3 | 24.7 | 29.7 | 41.9 | 54.6 | 71.2 | 92.9 | 121.2 |
| Depreciation, % | 20.08 | 13.03 | 22.63 | 22.39 | 17.73 | 19.17 | 19.17 | 19.17 | 19.17 | 19.17 |
| EBIT | 5.1 | 59.1 | 32.5 | 20.5 | 62.8 | 56.2 | 73.4 | 95.7 | 124.8 | 162.8 |
| EBIT, % | 8 | 38.62 | 26.03 | 18.64 | 37.47 | 25.75 | 25.75 | 25.75 | 25.75 | 25.75 |
| Total Cash | 22.6 | 43.0 | 26.0 | 19.4 | 21.9 | 50.4 | 65.7 | 85.7 | 111.8 | 145.8 |
| Total Cash, percent | .0 | .0 | .0 | .0 | .0 | .0 | .0 | .0 | .0 | .0 |
| Account Receivables | .8 | .0 | 1.5 | 1.2 | 7.7 | 3.6 | 4.7 | 6.1 | 7.9 | 10.3 |
| Account Receivables, % | 1.26 | 0 | 1.24 | 1.09 | 4.58 | 1.64 | 1.64 | 1.64 | 1.64 | 1.64 |
| Inventories | 4.7 | 1.4 | 2.0 | 1.6 | 1.7 | 5.4 | 7.0 | 9.1 | 11.9 | 15.6 |
| Inventories, % | 7.34 | 0.94574 | 1.6 | 1.41 | 1.01 | 2.46 | 2.46 | 2.46 | 2.46 | 2.46 |
| Accounts Payable | 3.7 | 5.8 | 7.8 | 5.5 | 7.1 | 11.0 | 14.3 | 18.7 | 24.3 | 31.7 |
| Accounts Payable, % | 5.85 | 3.76 | 6.26 | 4.98 | 4.25 | 5.02 | 5.02 | 5.02 | 5.02 | 5.02 |
| Capital Expenditure | -20.3 | -197.3 | -70.5 | -.5 | -74.4 | -101.9 | -132.9 | -173.3 | -226.1 | -294.9 |
| Capital Expenditure, % | -31.99 | -128.88 | -56.35 | -0.44451 | -44.4 | -46.64 | -46.64 | -46.64 | -46.64 | -46.64 |
| Tax Rate, % | 0 | 0 | 0 | 0 | 0 | 0 | 0 | 0 | 0 | 0 |
| EBITAT | 5.1 | 59.1 | 32.5 | 20.5 | 62.8 | 56.2 | 73.4 | 95.7 | 124.8 | 162.8 |
| Depreciation | ||||||||||
| Changes in Account Receivables | ||||||||||
| Changes in Inventories | ||||||||||
| Changes in Accounts Payable | ||||||||||
| Capital Expenditure | ||||||||||
| UFCF | -4.2 | -112.2 | -9.6 | 43.2 | 13.1 | .5 | -4.3 | -5.6 | -7.3 | -9.5 |
| WACC, % | 7.34 | 7.34 | 7.34 | 7.34 | 7.34 | 7.34 | 7.34 | 7.34 | 7.34 | 7.34 |
| PV UFCF | ||||||||||
| SUM PV UFCF | -19.8 | |||||||||
| Long Term Growth Rate, % | 1.00 | |||||||||
| Free cash flow (T + 1) | -10 | |||||||||
| Terminal Value | -151 | |||||||||
| Present Terminal Value | -106 | |||||||||
| Enterprise Value | -126 | |||||||||
| Net Debt | 236 | |||||||||
| Equity Value | -362 | |||||||||
| Diluted Shares Outstanding, MM | 20 | |||||||||
| Equity Value Per Share | -18.19 |
What You Will Get
- Real Seanergy Data: Preloaded financials – from revenue to EBIT – based on actual and projected figures for Seanergy Maritime Holdings Corp. (SHIP).
- Full Customization: Adjust all critical parameters (yellow cells) like WACC, growth %, and tax rates to fit your analysis.
- Instant Valuation Updates: Automatic recalculations to assess the impact of changes on Seanergy's fair value.
- Versatile Excel Template: Designed for quick edits, scenario testing, and detailed projections specific to Seanergy Maritime Holdings Corp. (SHIP).
- Time-Saving and Accurate: Avoid the hassle of building models from scratch while ensuring precision and flexibility.
Key Features
- Accurate Shipping Financials: Gain access to reliable pre-loaded historical data and future forecasts for Seanergy Maritime Holdings Corp. (SHIP).
- Adjustable Forecast Parameters: Modify highlighted cells such as WACC, growth rates, and margins to suit your analysis.
- Real-Time Calculations: Automatic updates for DCF, Net Present Value (NPV), and cash flow assessments.
- Interactive Dashboard: User-friendly charts and summaries to help visualize your valuation outcomes.
- Suitable for All Experience Levels: A straightforward, intuitive layout designed for investors, CFOs, and consultants alike.
How It Works
- Step 1: Download the prebuilt Excel template featuring Seanergy Maritime Holdings Corp. (SHIP) data.
- Step 2: Review the pre-filled sheets to grasp the essential metrics.
- Step 3: Modify forecasts and assumptions in the editable yellow cells (WACC, growth, margins).
- Step 4: Instantly see the recalculated results, including Seanergy's intrinsic value.
- Step 5: Make informed investment decisions or create reports based on the results.
Why Choose This Calculator for Seanergy Maritime Holdings Corp. (SHIP)?
- User-Friendly Interface: Tailored for both novice and experienced users.
- Customizable Inputs: Easily adjust parameters to suit your financial analysis.
- Real-Time Valuation: Observe immediate updates to Seanergy's valuation as you change inputs.
- Pre-Loaded Data: Comes with Seanergy's latest financial information for swift evaluations.
- Preferred by Experts: Utilized by investors and analysts for strategic decision-making.
Who Should Use This Product?
- Investors: Assess Seanergy Maritime Holdings Corp.'s (SHIP) valuation before making investment decisions.
- CFOs and Financial Analysts: Optimize valuation methodologies and validate financial forecasts.
- Startup Founders: Understand the valuation strategies of established maritime companies like Seanergy.
- Consultants: Provide comprehensive valuation reports for maritime industry clients.
- Students and Educators: Utilize real-time data to learn and teach valuation practices in finance.
What the Template Contains
- Historical Data: Includes Seanergy Maritime Holdings Corp.'s past financials and baseline forecasts.
- DCF and Levered DCF Models: Detailed templates to calculate Seanergy Maritime Holdings Corp.'s intrinsic value.
- WACC Sheet: Pre-built calculations for Weighted Average Cost of Capital.
- Editable Inputs: Modify key drivers like growth rates, EBITDA %, and CAPEX assumptions.
- Quarterly and Annual Statements: A complete breakdown of Seanergy Maritime Holdings Corp.'s financials.
- Interactive Dashboard: Visualize valuation results and projections dynamically.
Disclaimer
All information, articles, and product details provided on this website are for general informational and educational purposes only. We do not claim any ownership over, nor do we intend to infringe upon, any trademarks, copyrights, logos, brand names, or other intellectual property mentioned or depicted on this site. Such intellectual property remains the property of its respective owners, and any references here are made solely for identification or informational purposes, without implying any affiliation, endorsement, or partnership.
We make no representations or warranties, express or implied, regarding the accuracy, completeness, or suitability of any content or products presented. Nothing on this website should be construed as legal, tax, investment, financial, medical, or other professional advice. In addition, no part of this site—including articles or product references—constitutes a solicitation, recommendation, endorsement, advertisement, or offer to buy or sell any securities, franchises, or other financial instruments, particularly in jurisdictions where such activity would be unlawful.
All content is of a general nature and may not address the specific circumstances of any individual or entity. It is not a substitute for professional advice or services. Any actions you take based on the information provided here are strictly at your own risk. You accept full responsibility for any decisions or outcomes arising from your use of this website and agree to release us from any liability in connection with your use of, or reliance upon, the content or products found herein.