
|
Valoración DCF de The Shyft Group, Inc. (SHYF) |
Completamente Editable: Adáptelo A Sus Necesidades En Excel O Sheets
Diseño Profesional: Plantillas Confiables Y Estándares De La Industria
Predeterminadas Para Un Uso Rápido Y Eficiente
Compatible con MAC / PC, completamente desbloqueado
No Se Necesita Experiencia; Fáciles De Seguir
The Shyft Group, Inc. (SHYF) Bundle
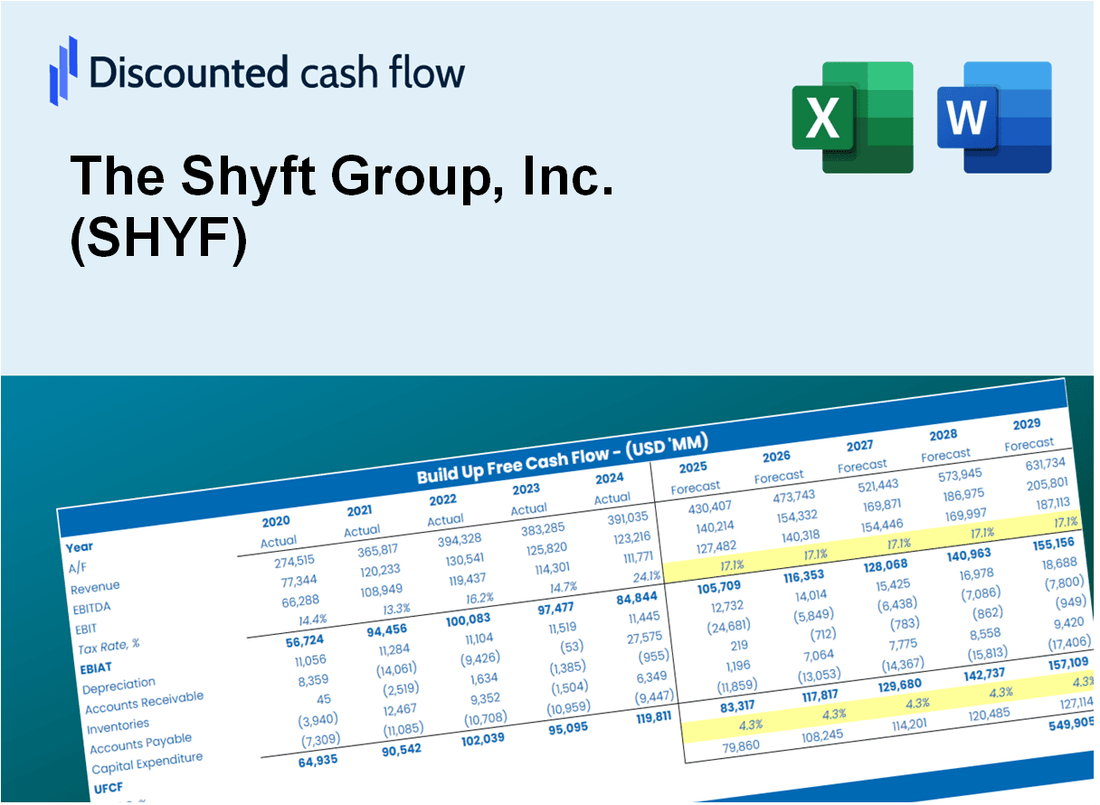
Ya sea que sea un inversionista o analista, esta calculadora DCF (Shyf) es su recurso de referencia para una valoración precisa. Con datos reales de The Shyft Group, Inc., puede ajustar las previsiones e inmediatamente observar los efectos.
Discounted Cash Flow (DCF) - (USD MM)
| Year | AY1 2020 |
AY2 2021 |
AY3 2022 |
AY4 2023 |
AY5 2024 |
FY1 2025 |
FY2 2026 |
FY3 2027 |
FY4 2028 |
FY5 2029 |
|---|---|---|---|---|---|---|---|---|---|---|
| Revenue | 676,0 | 991,8 | 1 027,2 | 872,2 | 786,2 | 836,0 | 888,9 | 945,2 | 1 005,1 | 1 068,8 |
| Revenue Growth, % | 0 | 46.72 | 3.57 | -15.09 | -9.86 | 6.33 | 6.33 | 6.33 | 6.33 | 6.33 |
| EBITDA | 63,4 | 96,3 | 61,5 | 24,2 | 26,6 | 52,2 | 55,5 | 59,0 | 62,8 | 66,7 |
| EBITDA, % | 9.37 | 9.71 | 5.99 | 2.77 | 3.38 | 6.24 | 6.24 | 6.24 | 6.24 | 6.24 |
| Depreciation | 13,9 | 11,4 | 14,8 | 17,0 | 20,3 | 15,3 | 16,3 | 17,3 | 18,4 | 19,6 |
| Depreciation, % | 2.06 | 1.15 | 1.44 | 1.94 | 2.58 | 1.83 | 1.83 | 1.83 | 1.83 | 1.83 |
| EBIT | 49,4 | 84,9 | 46,8 | 7,2 | 6,3 | 36,9 | 39,2 | 41,7 | 44,3 | 47,2 |
| EBIT, % | 7.32 | 8.56 | 4.55 | 0.82814 | 0.80275 | 4.41 | 4.41 | 4.41 | 4.41 | 4.41 |
| Total Cash | 21,0 | 37,2 | 11,5 | 10,0 | 15,8 | 18,6 | 19,8 | 21,0 | 22,4 | 23,8 |
| Total Cash, percent | 3.11 | 3.75 | 1.12 | 1.14 | 2.01 | 2.23 | 2.23 | 2.23 | 2.23 | 2.23 |
| Account Receivables | 80,6 | 118,7 | 222,3 | 164,4 | 164,6 | 142,6 | 151,7 | 161,3 | 171,5 | 182,4 |
| Account Receivables, % | 11.93 | 11.97 | 21.64 | 18.85 | 20.94 | 17.06 | 17.06 | 17.06 | 17.06 | 17.06 |
| Inventories | 46,4 | 67,2 | 100,2 | 105,1 | 109,9 | 82,6 | 87,9 | 93,4 | 99,3 | 105,6 |
| Inventories, % | 6.87 | 6.77 | 9.75 | 12.05 | 13.97 | 9.88 | 9.88 | 9.88 | 9.88 | 9.88 |
| Accounts Payable | 47,5 | 82,4 | 124,3 | 99,9 | 95,1 | 85,2 | 90,7 | 96,4 | 102,5 | 109,0 |
| Accounts Payable, % | 7.02 | 8.31 | 12.1 | 11.45 | 12.1 | 10.2 | 10.2 | 10.2 | 10.2 | 10.2 |
| Capital Expenditure | -14,5 | -23,0 | -20,6 | -20,7 | -13,7 | -17,7 | -18,8 | -20,0 | -21,3 | -22,6 |
| Capital Expenditure, % | -2.15 | -2.32 | -2 | -2.38 | -1.74 | -2.12 | -2.12 | -2.12 | -2.12 | -2.12 |
| Tax Rate, % | -25.39 | -25.39 | -25.39 | -25.39 | -25.39 | -25.39 | -25.39 | -25.39 | -25.39 | -25.39 |
| EBITAT | 33,7 | 69,3 | 38,9 | 67,4 | 7,9 | 31,9 | 34,0 | 36,1 | 38,4 | 40,8 |
| Depreciation | ||||||||||
| Changes in Account Receivables | ||||||||||
| Changes in Inventories | ||||||||||
| Changes in Accounts Payable | ||||||||||
| Capital Expenditure | ||||||||||
| UFCF | -46,5 | 33,8 | -61,6 | 92,1 | 4,8 | 68,9 | 22,6 | 24,0 | 25,5 | 27,1 |
| WACC, % | 10.22 | 10.41 | 10.43 | 10.67 | 10.67 | 10.48 | 10.48 | 10.48 | 10.48 | 10.48 |
| PV UFCF | ||||||||||
| SUM PV UFCF | ,0 | ,0 | ,0 | ,0 | ,0 | ,0 | ,0 | ,0 | ,0 | 132,2 |
| Long Term Growth Rate, % | 2.00 | |||||||||
| Free cash flow (T + 1) | 28 | |||||||||
| Terminal Value | 326 | |||||||||
| Present Terminal Value | 198 | |||||||||
| Enterprise Value | 330 | |||||||||
| Net Debt | 160 | |||||||||
| Equity Value | 171 | |||||||||
| Diluted Shares Outstanding, MM | 34 | |||||||||
| Equity Value Per Share | 4.96 |
What You Will Get
- Pre-Filled Financial Model: The Shyft Group's actual data allows for accurate DCF valuation.
- Full Forecast Control: Modify revenue growth, margins, WACC, and other essential drivers.
- Instant Calculations: Automatic updates provide immediate results as you make adjustments.
- Investor-Ready Template: A polished Excel file crafted for professional-level valuation.
- Customizable and Reusable: Designed for adaptability, enabling repeated use for comprehensive forecasts.
Key Features
- Comprehensive DCF Calculator: Features both unlevered and levered DCF valuation models tailored for The Shyft Group, Inc. (SHYF).
- WACC Calculator: Includes a pre-built Weighted Average Cost of Capital sheet with adjustable parameters.
- Customizable Forecast Assumptions: Easily adjust growth rates, capital expenditures, and discount rates.
- Integrated Financial Ratios: Evaluate profitability, leverage, and efficiency ratios specific to The Shyft Group, Inc. (SHYF).
- Interactive Dashboard and Charts: Visual representations that highlight essential valuation metrics for straightforward analysis.
How It Works
- Step 1: Download the Excel file.
- Step 2: Review pre-entered Shyft Group data (historical and projected).
- Step 3: Adjust key assumptions (yellow cells) based on your analysis.
- Step 4: View automatic recalculations for Shyft Group’s intrinsic value.
- Step 5: Use the outputs for investment decisions or reporting.
Why Choose This Calculator for The Shyft Group, Inc. (SHYF)?
- Designed for Industry Experts: A sophisticated tool utilized by analysts, CFOs, and consultants in the transportation sector.
- Accurate Financial Data: The Shyft Group’s historical and projected financials are preloaded for precision.
- Flexible Scenario Analysis: Effortlessly simulate various forecasts and assumptions.
- Comprehensive Outputs: Automatically computes intrinsic value, NPV, and essential financial metrics.
- User-Friendly Interface: Detailed, step-by-step instructions make navigation simple.
Who Should Use This Product?
- Professional Investors: Develop comprehensive valuation models for analyzing investments in The Shyft Group, Inc. (SHYF).
- Corporate Finance Teams: Assess valuation scenarios to inform strategic decisions within the company.
- Consultants and Advisors: Deliver precise valuation insights for clients interested in The Shyft Group, Inc. (SHYF).
- Students and Educators: Utilize real-world data to enhance financial modeling skills and education.
- Industry Analysts: Gain insights into how transportation and logistics companies like The Shyft Group, Inc. (SHYF) are valued in the market.
What the Template Contains
- Pre-Filled DCF Model: The Shyft Group’s (SHYF) financial data preloaded for immediate use.
- WACC Calculator: Detailed calculations for Weighted Average Cost of Capital specific to The Shyft Group.
- Financial Ratios: Evaluate The Shyft Group’s profitability, leverage, and efficiency metrics.
- Editable Inputs: Modify assumptions such as growth, margins, and CAPEX to tailor your scenarios.
- Financial Statements: Annual and quarterly reports to facilitate thorough analysis of The Shyft Group.
- Interactive Dashboard: Easily visualize key valuation metrics and results for The Shyft Group.
Disclaimer
All information, articles, and product details provided on this website are for general informational and educational purposes only. We do not claim any ownership over, nor do we intend to infringe upon, any trademarks, copyrights, logos, brand names, or other intellectual property mentioned or depicted on this site. Such intellectual property remains the property of its respective owners, and any references here are made solely for identification or informational purposes, without implying any affiliation, endorsement, or partnership.
We make no representations or warranties, express or implied, regarding the accuracy, completeness, or suitability of any content or products presented. Nothing on this website should be construed as legal, tax, investment, financial, medical, or other professional advice. In addition, no part of this site—including articles or product references—constitutes a solicitation, recommendation, endorsement, advertisement, or offer to buy or sell any securities, franchises, or other financial instruments, particularly in jurisdictions where such activity would be unlawful.
All content is of a general nature and may not address the specific circumstances of any individual or entity. It is not a substitute for professional advice or services. Any actions you take based on the information provided here are strictly at your own risk. You accept full responsibility for any decisions or outcomes arising from your use of this website and agree to release us from any liability in connection with your use of, or reliance upon, the content or products found herein.