
|
Valoración DCF de la Companhia Siderúrgica Nacional (SID) |
Completamente Editable: Adáptelo A Sus Necesidades En Excel O Sheets
Diseño Profesional: Plantillas Confiables Y Estándares De La Industria
Predeterminadas Para Un Uso Rápido Y Eficiente
Compatible con MAC / PC, completamente desbloqueado
No Se Necesita Experiencia; Fáciles De Seguir
Companhia Siderúrgica Nacional (SID) Bundle
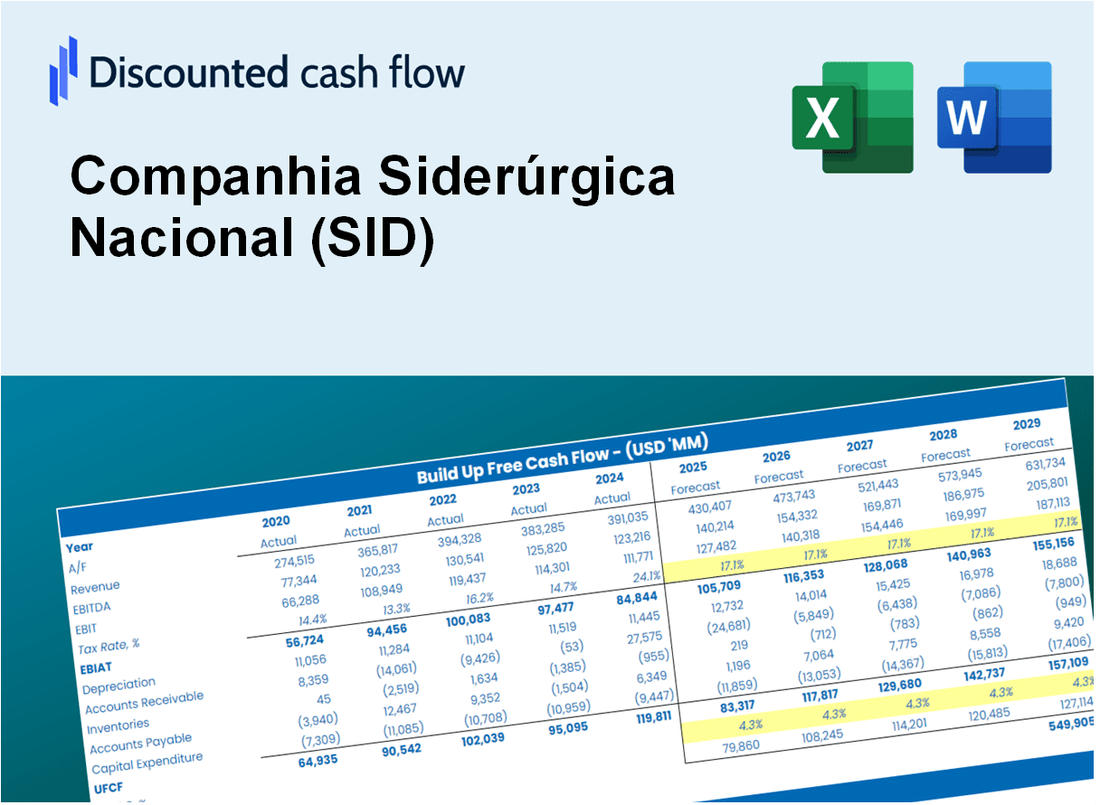
¡Descubra el verdadero potencial de Companhia Siderúrgica Nacional (SID) con nuestra calculadora DCF avanzada! Ajuste los supuestos clave, explore varios escenarios y examine cómo los diferentes factores influyen en la valoración de la compañía Siderúrgica (SID), todo dentro de una sola plantilla de Excel.
Discounted Cash Flow (DCF) - (USD MM)
| Year | AY1 2020 |
AY2 2021 |
AY3 2022 |
AY4 2023 |
AY5 2024 |
FY1 2025 |
FY2 2026 |
FY3 2027 |
FY4 2028 |
FY5 2029 |
|---|---|---|---|---|---|---|---|---|---|---|
| Revenue | 5,672.9 | 9,040.7 | 8,370.8 | 8,573.8 | 8,243.5 | 9,284.9 | 10,457.8 | 11,778.9 | 13,266.9 | 14,942.8 |
| Revenue Growth, % | 0 | 59.37 | -7.41 | 2.43 | -3.85 | 12.63 | 12.63 | 12.63 | 12.63 | 12.63 |
| EBITDA | 1,828.7 | 4,354.9 | 1,900.5 | 1,619.8 | 1,374.6 | 2,575.2 | 2,900.5 | 3,266.9 | 3,679.6 | 4,144.4 |
| EBITDA, % | 32.24 | 48.17 | 22.7 | 18.89 | 16.67 | 27.74 | 27.74 | 27.74 | 27.74 | 27.74 |
| Depreciation | 471.8 | 419.1 | 543.5 | 637.6 | 653.4 | 646.4 | 728.1 | 820.0 | 923.6 | 1,040.3 |
| Depreciation, % | 8.32 | 4.64 | 6.49 | 7.44 | 7.93 | 6.96 | 6.96 | 6.96 | 6.96 | 6.96 |
| EBIT | 1,356.8 | 3,935.8 | 1,357.0 | 982.2 | 721.2 | 1,928.8 | 2,172.5 | 2,446.9 | 2,756.0 | 3,104.1 |
| EBIT, % | 23.92 | 43.53 | 16.21 | 11.46 | 8.75 | 20.77 | 20.77 | 20.77 | 20.77 | 20.77 |
| Total Cash | 2,591.3 | 3,642.4 | 2,537.5 | 3,310.9 | 4,571.0 | 3,906.1 | 4,399.6 | 4,955.3 | 5,581.3 | 6,286.4 |
| Total Cash, percent | .0 | .0 | .0 | .0 | .0 | .0 | .0 | .0 | .0 | .0 |
| Account Receivables | 548.2 | 826.5 | 989.3 | 617.0 | 862.2 | 896.6 | 1,009.8 | 1,137.4 | 1,281.1 | 1,442.9 |
| Account Receivables, % | 9.66 | 9.14 | 11.82 | 7.2 | 10.46 | 9.66 | 9.66 | 9.66 | 9.66 | 9.66 |
| Inventories | 909.0 | 2,065.0 | 2,130.2 | 1,803.5 | 1,969.9 | 2,028.7 | 2,284.9 | 2,573.6 | 2,898.7 | 3,264.8 |
| Inventories, % | 16.02 | 22.84 | 25.45 | 21.03 | 23.9 | 21.85 | 21.85 | 21.85 | 21.85 | 21.85 |
| Accounts Payable | 1,027.1 | 2,054.3 | 2,322.1 | 1,464.6 | 1,874.4 | 2,012.8 | 2,267.0 | 2,553.4 | 2,876.0 | 3,239.3 |
| Accounts Payable, % | 18.11 | 22.72 | 27.74 | 17.08 | 22.74 | 21.68 | 21.68 | 21.68 | 21.68 | 21.68 |
| Capital Expenditure | -317.7 | -540.6 | -1,014.5 | -831.8 | -1,036.7 | -853.8 | -961.6 | -1,083.1 | -1,219.9 | -1,374.1 |
| Capital Expenditure, % | -5.6 | -5.98 | -12.12 | -9.7 | -12.58 | -9.2 | -9.2 | -9.2 | -9.2 | -9.2 |
| Tax Rate, % | -67.94 | -67.94 | -67.94 | -67.94 | -67.94 | -67.94 | -67.94 | -67.94 | -67.94 | -67.94 |
| EBITAT | 1,046.8 | 2,594.5 | 712.9 | -301.9 | 1,211.1 | 1,140.3 | 1,284.4 | 1,446.6 | 1,629.4 | 1,835.2 |
| Depreciation | ||||||||||
| Changes in Account Receivables | ||||||||||
| Changes in Inventories | ||||||||||
| Changes in Accounts Payable | ||||||||||
| Capital Expenditure | ||||||||||
| UFCF | 770.7 | 2,066.1 | 281.6 | -654.4 | 825.8 | 978.3 | 935.5 | 1,053.7 | 1,186.8 | 1,336.7 |
| WACC, % | 7.07 | 6.33 | 5.46 | 2.01 | 8.57 | 5.89 | 5.89 | 5.89 | 5.89 | 5.89 |
| PV UFCF | ||||||||||
| SUM PV UFCF | 4,594.0 | |||||||||
| Long Term Growth Rate, % | 2.00 | |||||||||
| Free cash flow (T + 1) | 1,363 | |||||||||
| Terminal Value | 35,069 | |||||||||
| Present Terminal Value | 26,344 | |||||||||
| Enterprise Value | 30,938 | |||||||||
| Net Debt | 6,499 | |||||||||
| Equity Value | 24,439 | |||||||||
| Diluted Shares Outstanding, MM | 1,326 | |||||||||
| Equity Value Per Share | 18.43 |
What You Will Get
- Editable Excel Template: A fully customizable Excel-based DCF Calculator featuring pre-filled real Companhia Siderúrgica Nacional (SID) financials.
- Real-World Data: Historical data and forward-looking estimates (highlighted in the yellow cells).
- Forecast Flexibility: Adjust forecast assumptions such as revenue growth, EBITDA %, and WACC.
- Automatic Calculations: Instantly observe the effects of your inputs on Companhia Siderúrgica Nacional’s valuation.
- Professional Tool: Designed for investors, CFOs, consultants, and financial analysts.
- User-Friendly Design: Organized for clarity and ease of use, complete with step-by-step instructions.
Key Features
- Accurate CSN Financials: Gain access to reliable pre-loaded historical data and future forecasts for Companhia Siderúrgica Nacional (SID).
- Adjustable Forecast Assumptions: Modify the highlighted cells such as WACC, growth rates, and profit margins.
- Real-time Calculations: Automatic updates for DCF, Net Present Value (NPV), and cash flow analysis.
- Interactive Dashboard: User-friendly charts and summaries to help you visualize your valuation outcomes.
- Designed for All Users: A straightforward, intuitive layout tailored for investors, CFOs, and consultants alike.
How It Works
- Step 1: Download the Excel file.
- Step 2: Review pre-entered Companhia Siderúrgica Nacional (SID) data (historical and projected).
- Step 3: Adjust key assumptions (yellow cells) based on your analysis.
- Step 4: View automatic recalculations for Companhia Siderúrgica Nacional’s (SID) intrinsic value.
- Step 5: Use the outputs for investment decisions or reporting.
Why Choose This Calculator for Companhia Siderúrgica Nacional (SID)?
- Accurate Data: Utilize real Companhia Siderúrgica Nacional financials for dependable valuation outcomes.
- Customizable: Tailor key inputs such as growth rates, WACC, and tax rates to align with your forecasts.
- Time-Saving: Pre-constructed calculations save you from starting from the ground up.
- Professional-Grade Tool: Crafted for investors, analysts, and consultants in the steel industry.
- User-Friendly: Easy-to-navigate design and clear instructions facilitate use for everyone.
Who Should Use Companhia Siderúrgica Nacional (SID)?
- Investors: Gain insights and make informed decisions with a leading steel producer.
- Financial Analysts: Streamline your analysis with comprehensive data on market trends and performance.
- Consultants: Easily tailor reports and presentations for clients in the industrial sector.
- Industry Enthusiasts: Enhance your knowledge of the steel industry and market dynamics through real-life case studies.
- Educators and Students: Utilize it as a valuable resource for learning about the steel market and corporate finance.
What the Template Contains
- Operating and Balance Sheet Data: Pre-filled Companhia Siderúrgica Nacional (SID) historical data and forecasts, including revenue, EBITDA, EBIT, and capital expenditures.
- WACC Calculation: A dedicated sheet for Weighted Average Cost of Capital (WACC), featuring parameters such as Beta, risk-free rate, and share price.
- DCF Valuation (Unlevered and Levered): Editable Discounted Cash Flow models illustrating intrinsic value with comprehensive calculations.
- Financial Statements: Pre-loaded financial statements (annual and quarterly) to facilitate analysis.
- Key Ratios: Includes profitability, leverage, and efficiency ratios for Companhia Siderúrgica Nacional (SID).
- Dashboard and Charts: Visual summary of valuation outputs and assumptions for easy result analysis.
Disclaimer
All information, articles, and product details provided on this website are for general informational and educational purposes only. We do not claim any ownership over, nor do we intend to infringe upon, any trademarks, copyrights, logos, brand names, or other intellectual property mentioned or depicted on this site. Such intellectual property remains the property of its respective owners, and any references here are made solely for identification or informational purposes, without implying any affiliation, endorsement, or partnership.
We make no representations or warranties, express or implied, regarding the accuracy, completeness, or suitability of any content or products presented. Nothing on this website should be construed as legal, tax, investment, financial, medical, or other professional advice. In addition, no part of this site—including articles or product references—constitutes a solicitation, recommendation, endorsement, advertisement, or offer to buy or sell any securities, franchises, or other financial instruments, particularly in jurisdictions where such activity would be unlawful.
All content is of a general nature and may not address the specific circumstances of any individual or entity. It is not a substitute for professional advice or services. Any actions you take based on the information provided here are strictly at your own risk. You accept full responsibility for any decisions or outcomes arising from your use of this website and agree to release us from any liability in connection with your use of, or reliance upon, the content or products found herein.